2.6 TOWARD AN ACCURATE TECHNICAL HISTORY OF THE WTC 7 COLLAPSE
WTC7 BUILDING MOVEMENT: INDEPENDENT MAPPING AND MEASUREMENTS OF THE EARLIEST DETECTABLE MOVEMENT THROUGH THE COLLAPSE INITIATION SEQUENCE
The collective visual record of the WTC7 collapse is examined directly and independently of all other sources, groups or individuals. The movement of the structure during the initial column failure sequence is mapped and traced back to the earliest point of detectable movement from multiple angles. Features of the initial failure sequence can be understood as a rapid succession of 7 identifiable events occurring in the following order:
1) Movement Detected from 2 Minutes before Collapse
2) Increase of rocking 6 seconds before visible collapse
3) Ejections and overpressurizations
4) Collapse of the East Penthouse
5) Collective core failure
6) Perimeter response
7) Acceleration downward
Collapse Progression and Rubble Distribution
1) Movement Detected from 2 Minutes before Collapse
The earliest detectable movement leading into the visible collapse process was never recognized in the NIST report shown in section 3.3). There is nothing within the NIST computer simulations that can explain this type of movement.
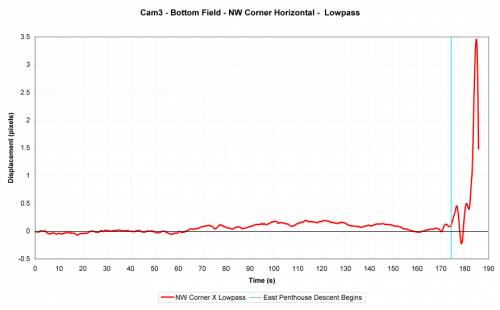
The trace process of the northwest corner using sub-pixel tracing (syntheyes) demonstrated:
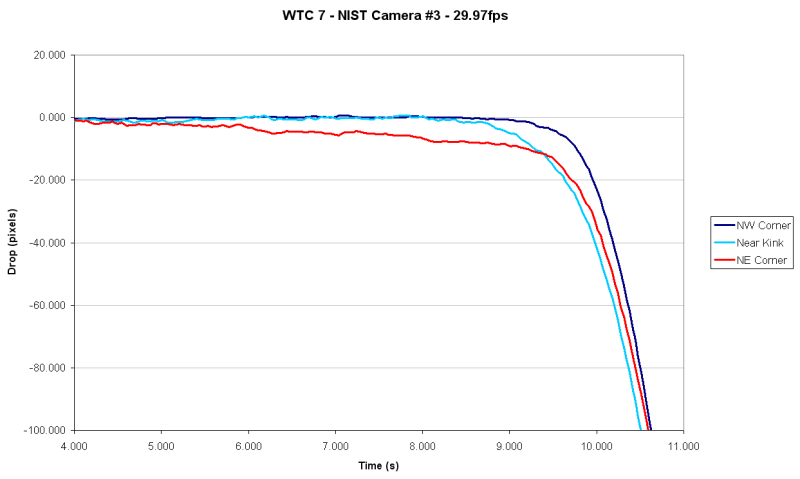
This camera angle is called the "camera #3 viewpoint" within the NIST report.
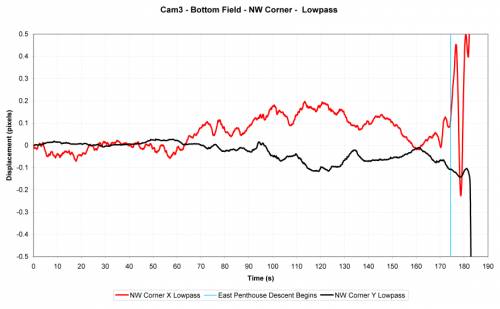
The corner started to rock back and forth at about 90 seconds before the visible collapse began. The movement is detectable by overlaying frames of the video.
The blue line indicates the moment when visible collapse first begins.
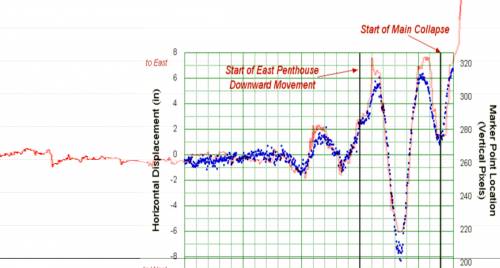
2) Increase of rocking 6 seconds before visible collapse
About 6 seconds before the collapse first becomes visible the northwest corner starts to rock more intensely. This movement was detected by the NIST and they consider it to be the earliest detectable motion. The first visible movement was the collapse of the east penthouse and is indicated in the graph. Once the east penthouse begins to fall, the rocking becomes much more intense until the whole core starts to fall collectively about 4 seconds later.
The NIST measurements are posted over independent confirmation. During this rocking motion from 6 seconds before the earliest visible collapse, both sets of measurements match well.
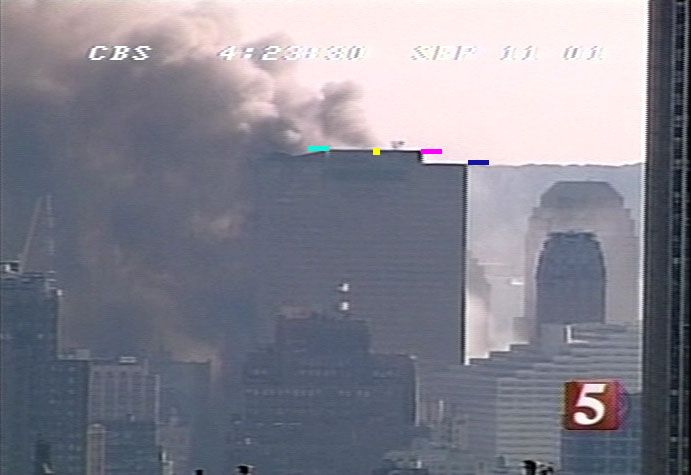
The facade behavior is examined using color enhancement during the east penthouse collapse:
5) Collective core failure
The first phase of core collapse is the east penthouse shown at 0:06 in this video:
The second phase seems to involve the rest of the collective core, which follows about 4 seconds later.
6) The perimeter response
Perimeter deformation as a response to the failure of the core is clearly observable:
Mapping the deformations from various angles allows for rough global model of perimeter flexure. The model describes the witnessed flexure of the perimeter as being the result of the core dropping in three sections as shown:
Drop curves for perimeter near the center, northwest corner and northeast corner compared
Coupled reaction between core and perimeter
Drop rates and velocities of core and perimeter compared
It appears that the core was slowed down by the perimeter. The core appears to have strained the floors, took down the perimeter and catapulted the outer shell downwards until the floors were once again less strained. After this it appears the whole interconnected unit fell together.
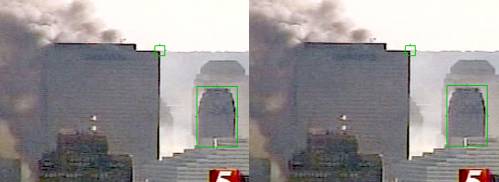
7) Downward isplacement, velocity, and acceleration of northwest corner of WTC7
Point tracked (marked) compared to static object (also marked)
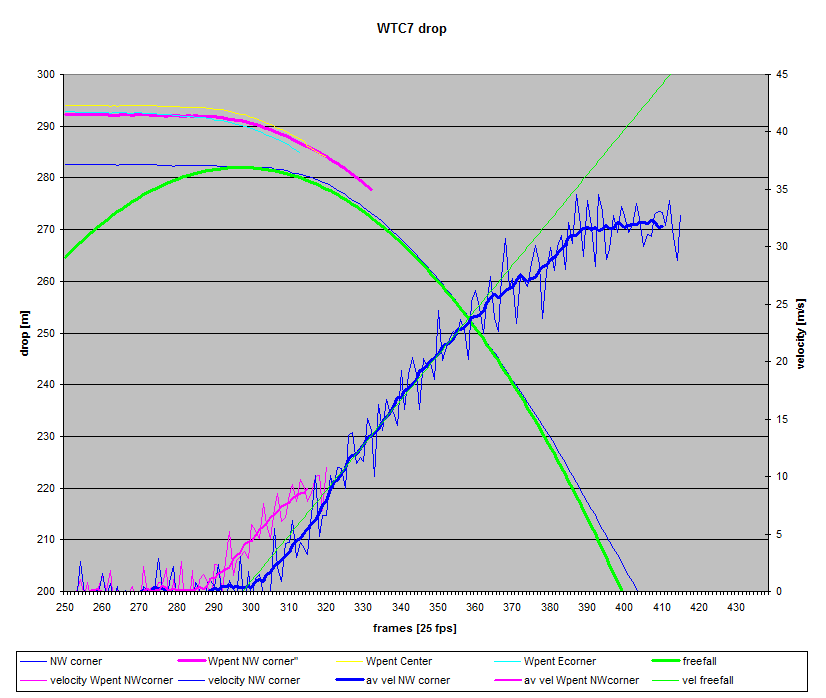
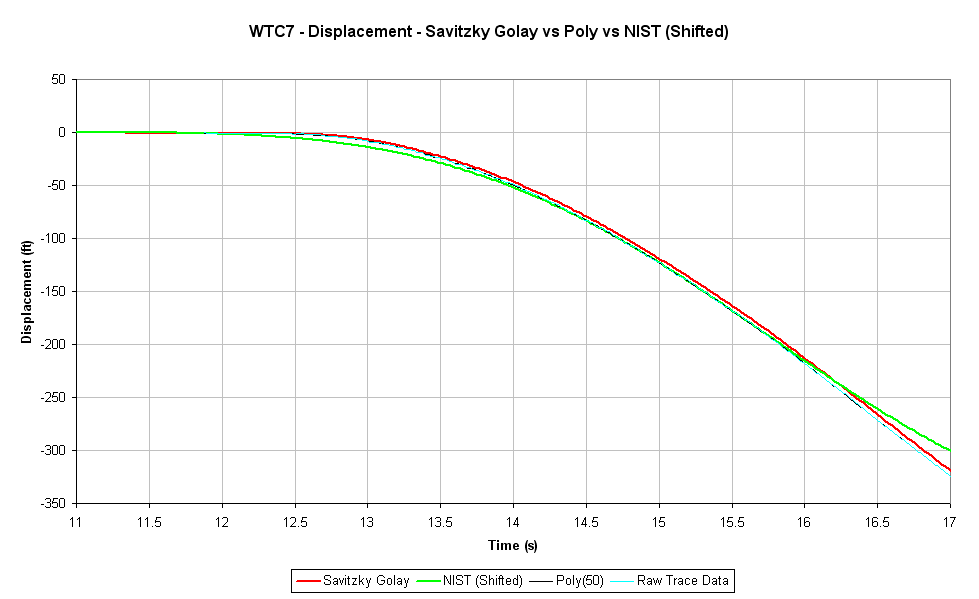
Downward displacement:
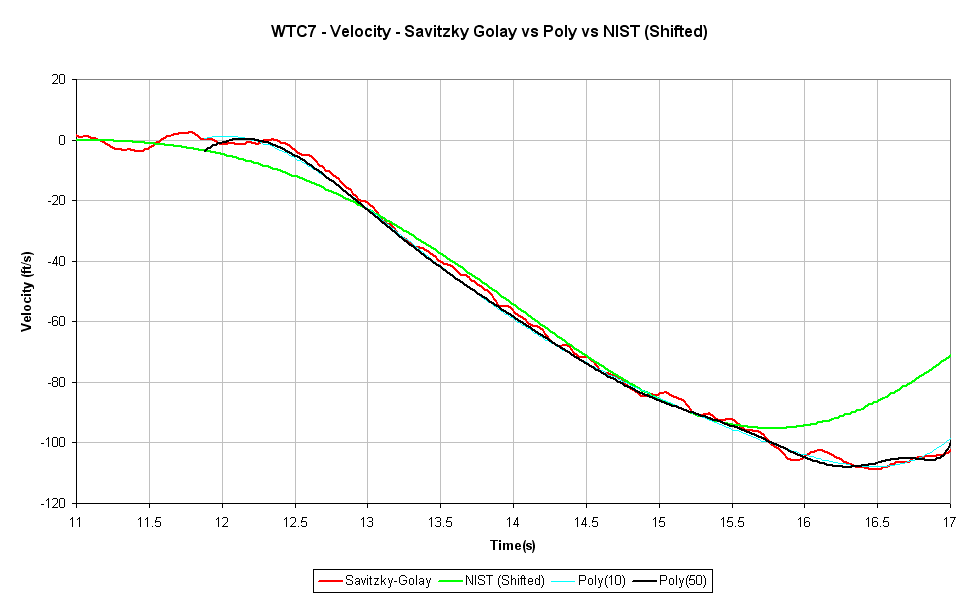
Velocity:
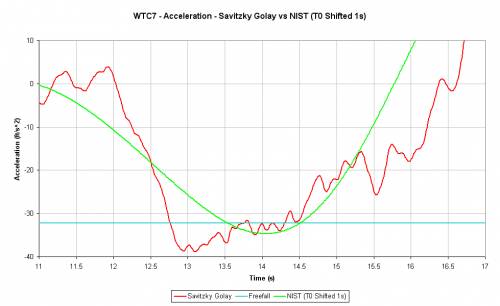
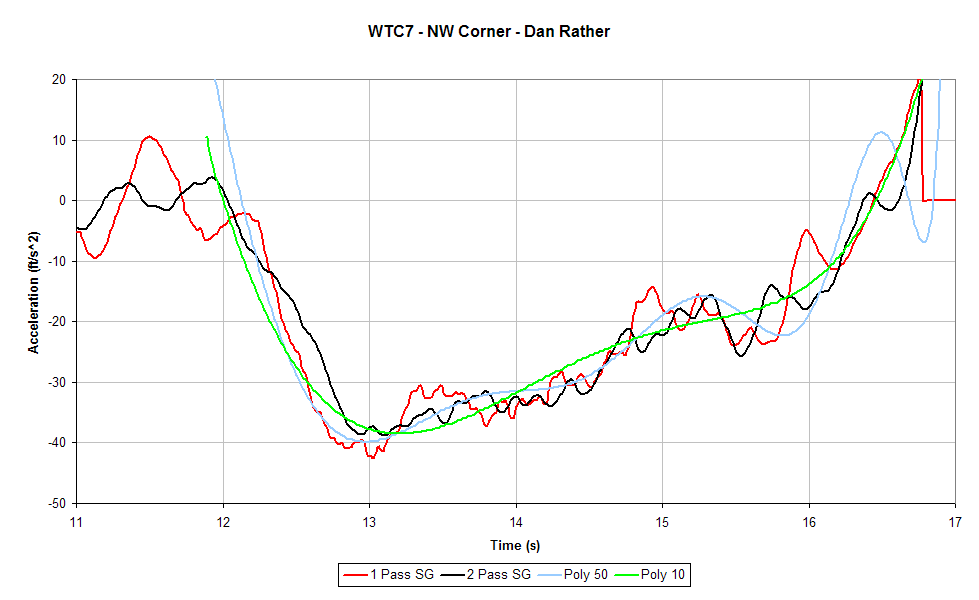
The acceleration profile given by the NIST is in green. A much more accurate acceleration profile is given in red. Free fall acceleration is marked by a blue line:
Multiple methods of extracting downward acceleration from displacement data yield the same trends:
The following gif shows the effect of varying the polynomial degree which fits the displacement graph on the resulting acceleration profile. Is starts with a zero degree fit and increases the polynomial degree in steps of 2:
Increasing the degree of the polynomial doesn't have much effect on the resulting acceleration trend.
So how is it possible for the perimeter to drop faster than free fall?
Core and perimeter were still connected through the floor system. Once the core dropped near gravitational acceleration the core-floor-perimeter could have acted like a spring system. First, the core pulled the perimeter inwards. Secondly, the perimeter failed at a very low elevation and was then pulled downwards by the "floor-springs". The falling core was slowed down at the same time until the entire system fell as one unit.
Of course the center of mass of the entire system cannot exceed gravitational acceleration, but a point on the extremity of the perimeter can.
COLLAPSE PROGRESSION AND COMPLETION
Due to the early fall of the east penthouse, one can assume that the core and perimeter on the east side of the building were not coupled together during the building collapse. The perimeter flexure, as it responded to collective core failure, also shows that the east side of the perimeter was decoupled from the core while the center area and west side of the perimeter was tightly coupled to the collective core.
There is further evidence of this during the collapse progression process. The section of the perimeter located farthest east fell slower than the rest of the perimeter and actually folded in on top of and over the rest of the building as shown in this short slow motion video:
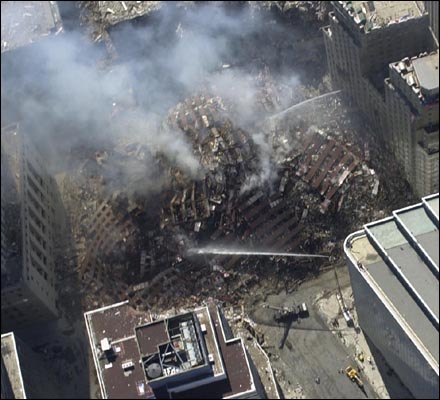
The resulting rubble distribution of the collapse of this 47 story building was quite compact:
There are more images of the resulting rubble at this link: