COLLECTED GRAPHICS OF THE TWIN TOWERS COLLAPSES
2001
2007-2008
2008
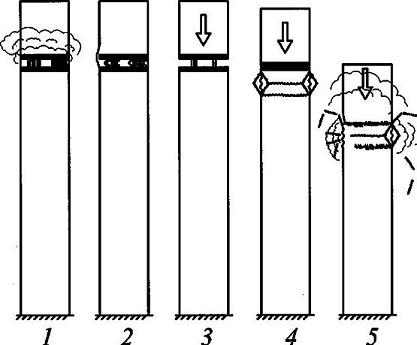
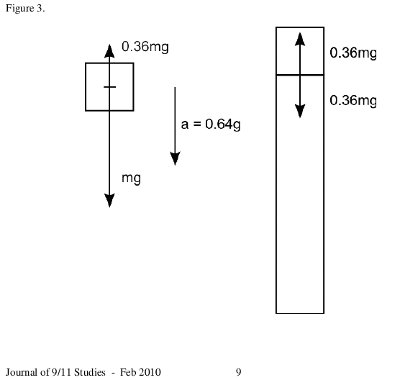
These are 2 graphis in 2008 but they are in response to Bazant, using the same 'block' symbols in a different way
2008
The following graphics of the North Tower tilting 8 degrees were drawn by two professional engineers.
They were both describing how the NIST represented the tilting process of the North Tower in their reports.
All the NIST decriptions and images they used to justify their descriptions are reproduced here.
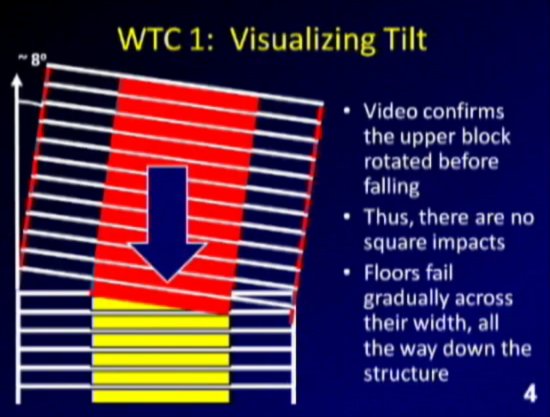
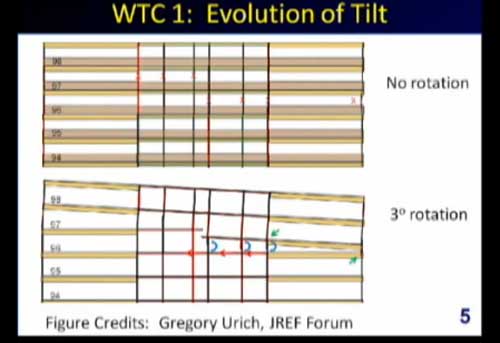
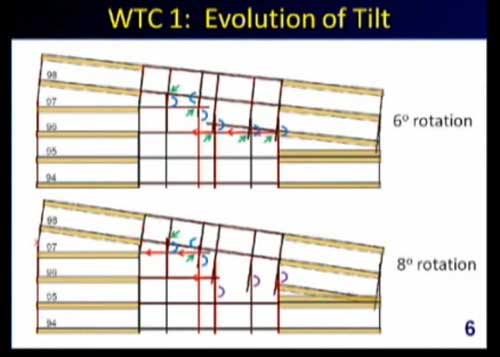
Both people drew the NIST descriptions correctly. They and the NIST were incorrect by more than 800%.
By exaggerating the actual tilt angle by more than 800% the NIST misrepresented the North Tower as being a 'perimeter-led' collapse
rather than a 'core-led' collapse which is much more consistent with the visual record of events.
2011
New York Magazine, As part of their "Encyclopedia of 9/11", in an article called "Total Progressive Collapse: Why, precisely, the towers fell."
By Matthew Giles, published Aug 27, 2011
Opening image:
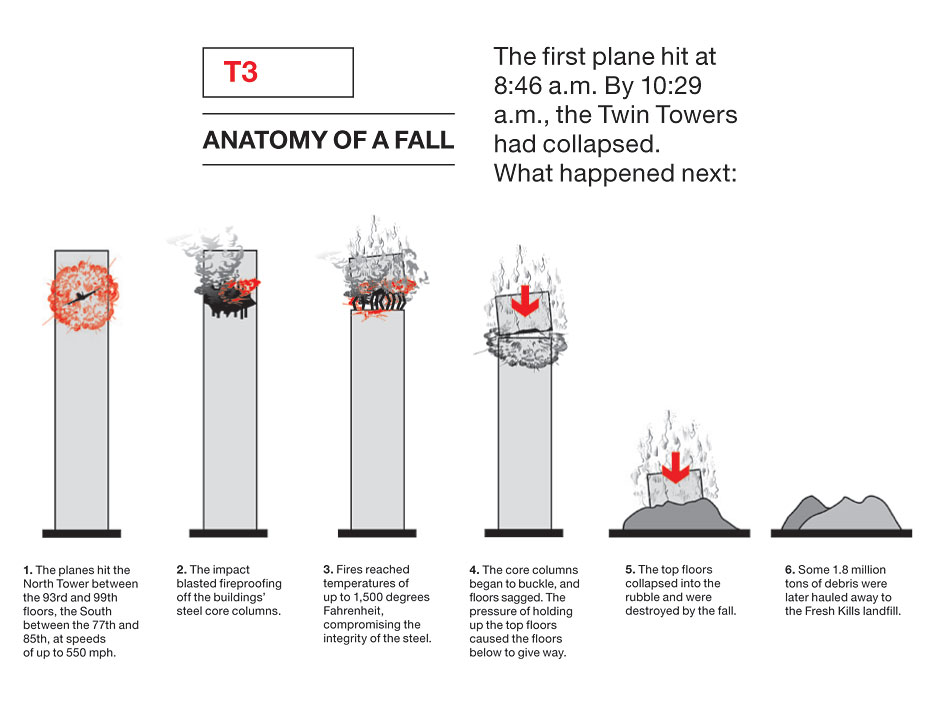
If one returns to the same website in 2021, the original is gone. This is the altered image:

Link to New York Magazine article: https://nymag.com/news/9-11/10th-anniversary/towers-collapse/
Note how the descriptions and the last 2 graphics have been removed from the image.
Also note the irony of the title of the original article: 'Why, precisely, the towers fell.
Precise indeed. The article was published 10 years after the collapses,
yet they had to edit out the fake parts of their own original story 10 years later.
Shamelessly, they do not even inform their own readers of the deleted features.
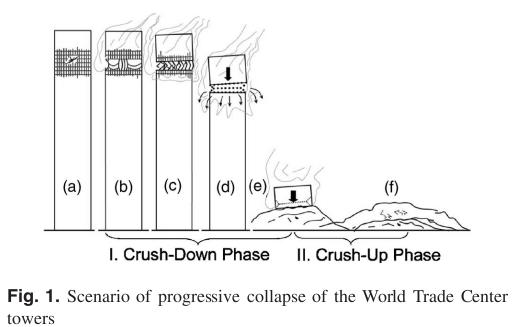
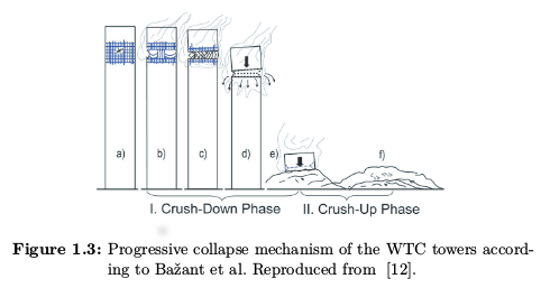
The two graphics that were removed are Bazants stage of 'crush-up'.
The New York Magazine edited out Bazants state of 'crush-up' and the descriptions describing each graphic.
But professional and academic publications kept publishing the same information uncorrected.
Two more Bazant papers describing the Twin Towers as the same 'crushing blocks' were published in 2011 and 2017.
Special note: Since this information first appeared on this website at the end of July, 2021, the article has been further edited to remove the comment that claimed to “explain, precisely, how the towers fell”. It disappeared between August 1 and August 24, 2021. The editor of that article is clearly aware of what is being written here.
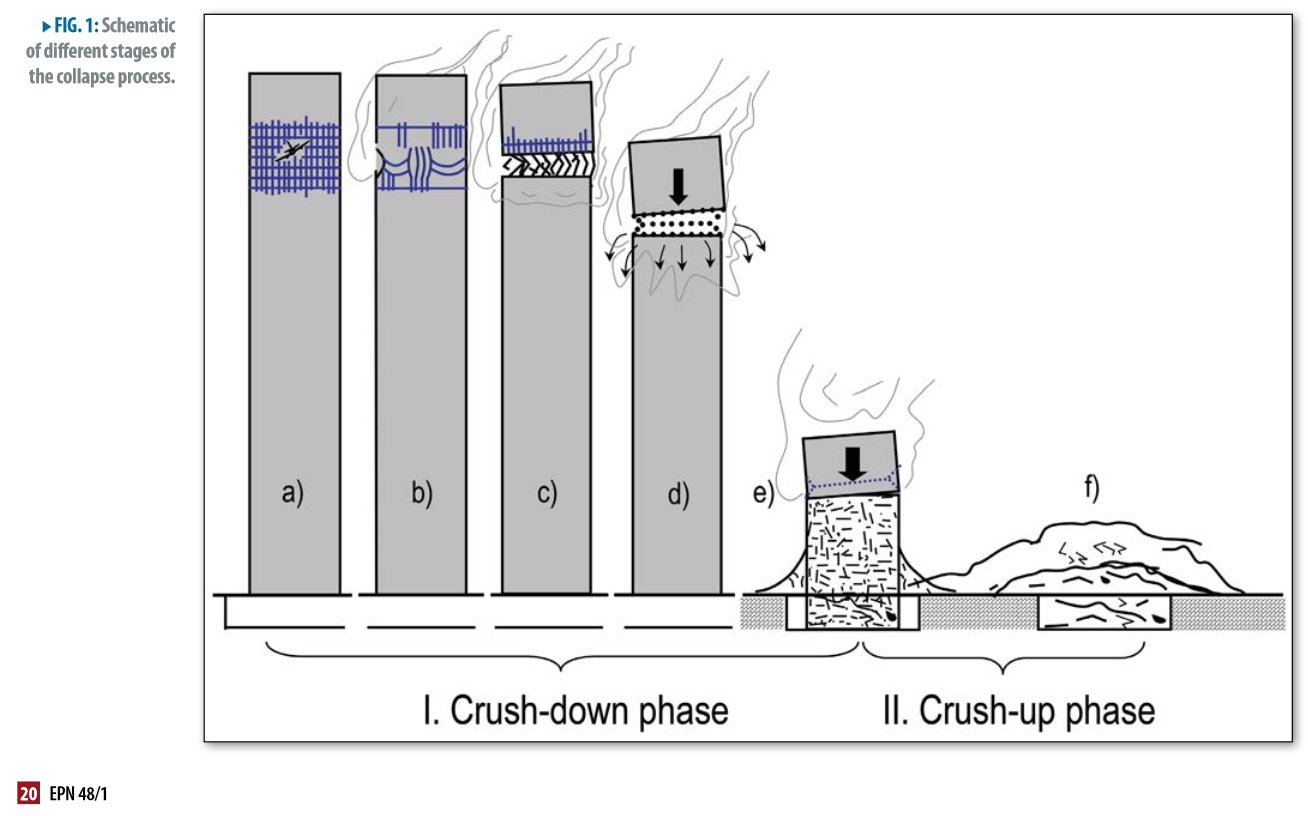
2017
The series of graphics on the Twin Towers collapses on this page are all similar
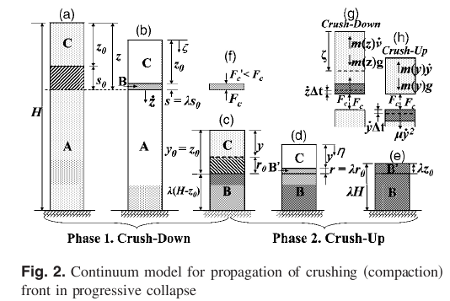
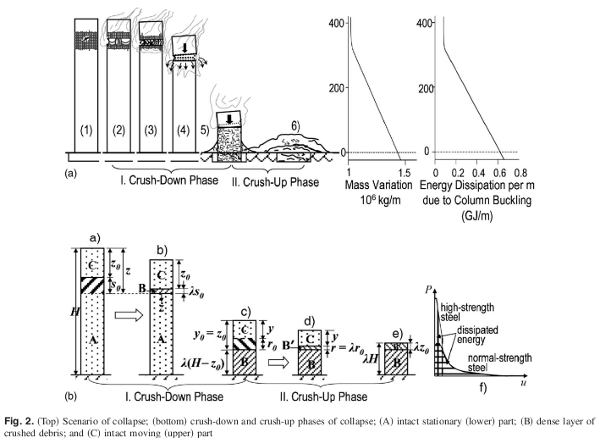
The first 5 graphics are all by Dr Bazant from 2001 to 2008.
The last graphic is from Dr Bazant in 2017 from an article in Europhysics News.
Every graphic on this page is wildly incorrect. They are all misrepresentations of the Twin Towers collapse modes. There has never been any effort to correct any of these mistakes.
The New York magazine made an effort to cover up their mistakes and hide them from their own readers.