WTC1 BUILDING MOVEMENT: INDEPENDENT MAPPING AND MEASUREMENTS OF THE EARLIEST DETECTABLE MOVEMENT THROUGH THE COLLAPSE INITIATION SEQUENCE
The collective visual record of the WTC1 collapse is examined directly and independently of all other sources, groups or individuals. The movement of the structure during the initial column failure sequence is mapped and traced back to the earliest point of detectable movement from multiple angles. Features of the initial failure sequence can be understood as a rapid succession of 10 identifiable events occurring in the following order:
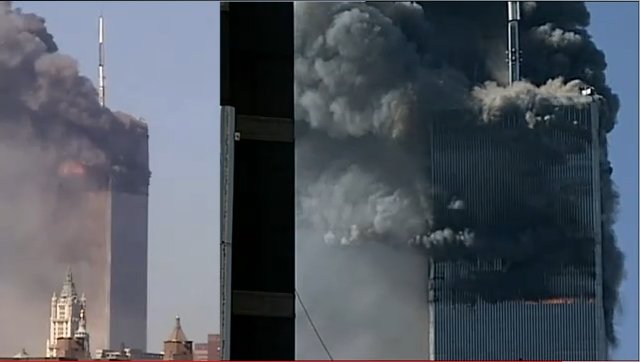
1) Deformations: Inward bowing of the south face
2) Inward bowing on the north face
3) Earliest detectable creep movement of the antenna and northwest corner
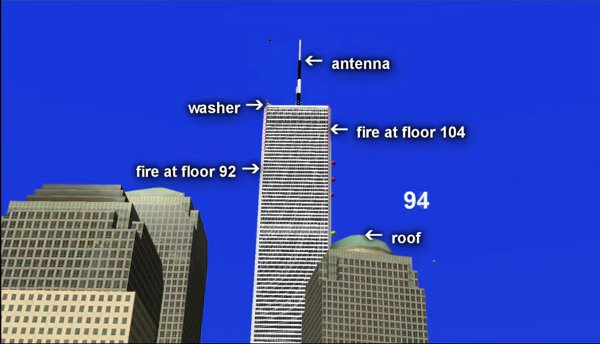
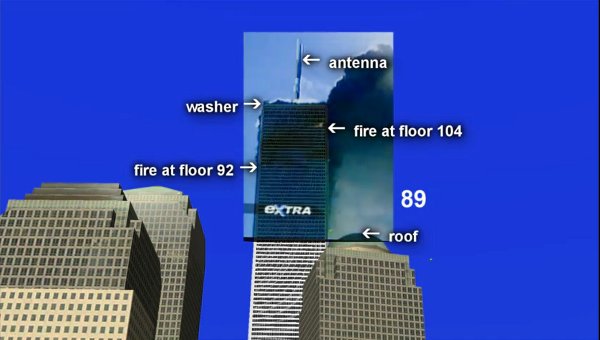
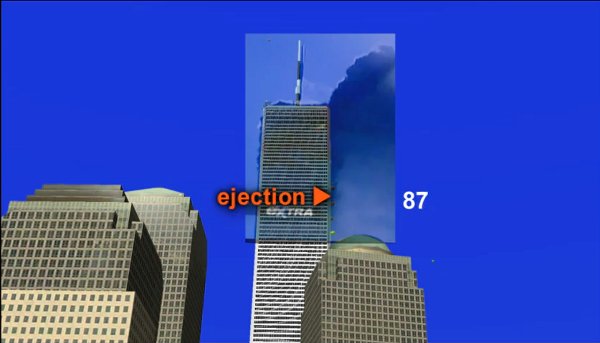
4) Appearance of ~87th fl S face ejections
5) Appearance of 95th fl W face ejection
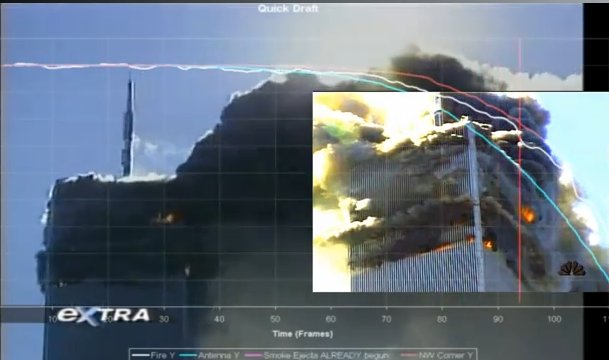
6) Visible downward movement begins: Concave deformation of the roofline, antenna drops before north or west perimeter walls
7) Columns fail over tilt of less than 1 degree, appearance of 98th fl ejections and 105th floor ejections
8) Appearance of 77th fl W face ejections
9 ) Splitting of all perimeter walls: All visible upper parts fall out and over lower parts
10 ) Southward sliding of upper portion
11 ) Dis-integration of upper portion
What people see as the beginning of visible downward movement is marked blue.
All claims are verifiable and all methods are reproducible.
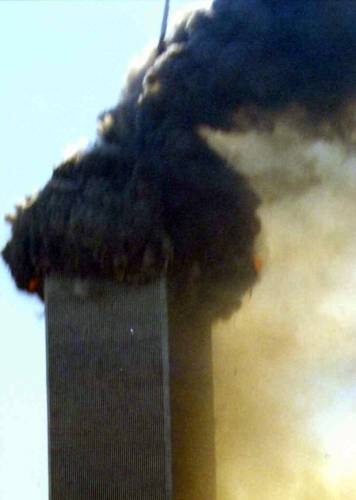
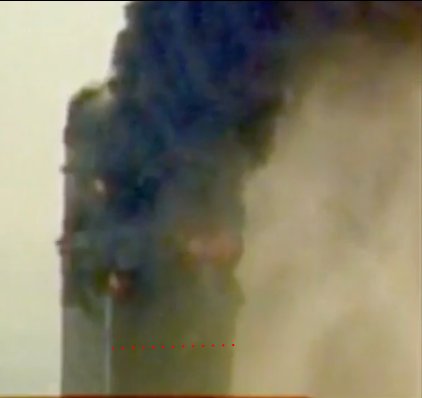
1) DEFORMATIONS:
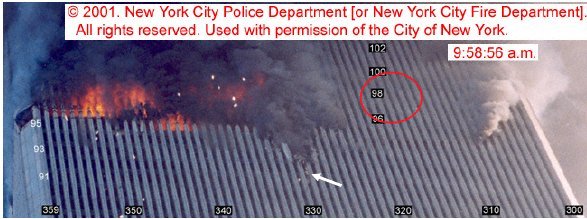
9:58
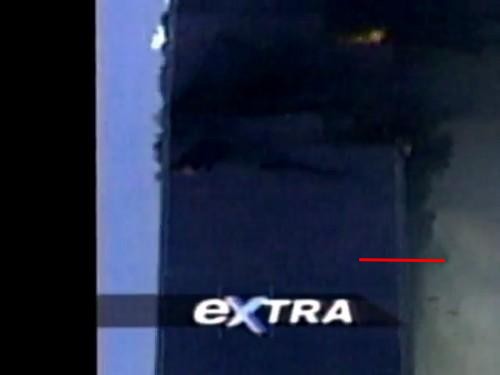
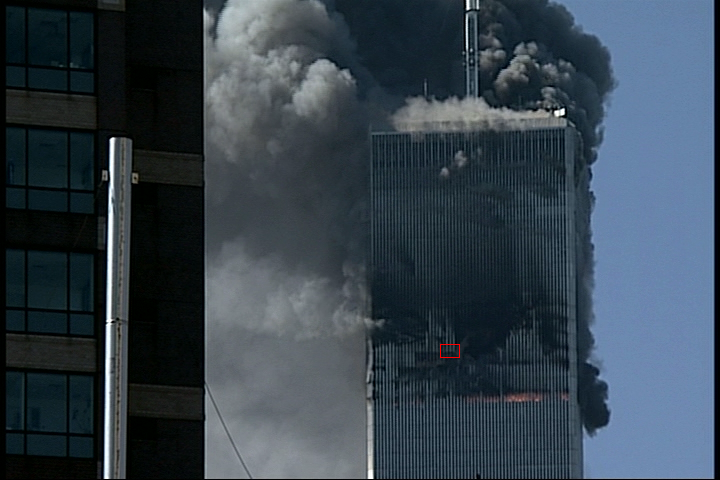
The area marked in red will be pulled inward about 55 inches in the next 24 minutes. Not only is there no sign of the inward bending at 9:58, but there are no visible fires in this location at this time.
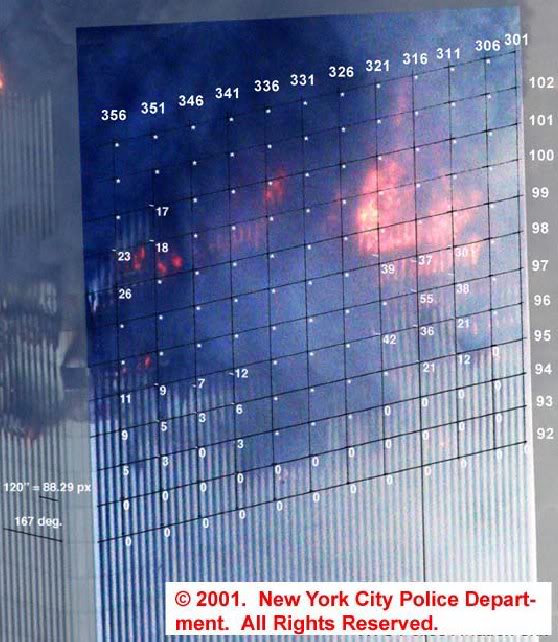
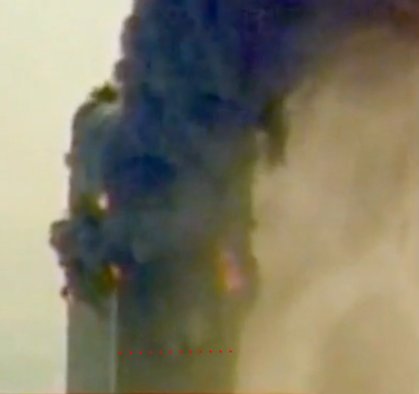
9:59 Structural change: 3 large fireballs emerge from the middle and east side of the south perimeter as WTC2 starts to collapse. These locations mark the center of where inward bowing will be visible after a few more minutes. Two clips which highlight the ejections:
The first detectable movement leading into the collapse initiation sequence begins 9.5 seconds before the visible collapse. Detailed examination within these links:
The Sauret video
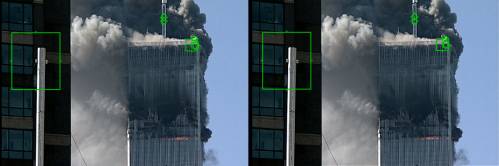
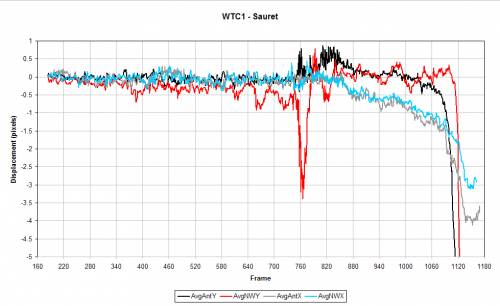
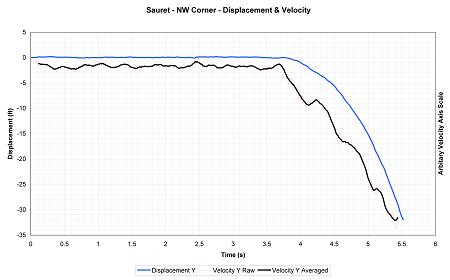
The Sauret video is shown below. At 9.5 seconds before visible collapse the camera noticeably shakes. This is when the slight movement of the antenna and northwest corner begin to be detected.
The first detectable motion begins just after the camera shakes in the video. The camera shake is clearly identifiable in both the video and the graph of the trace. From that moment, the pink and green lines tracking the antenna and upper northwest corner, respectively, begin to deviate from the static points.
The first 20 seconds are the original Sauret video.
Features:
1) The camera shakes about 9.5 seconds before collapse.
2) The antenna and the NW corner of the building begin to slowly move during or immediately after the camera shake.
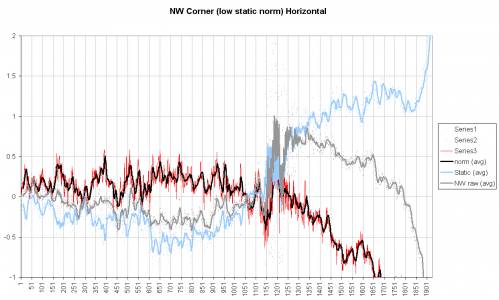
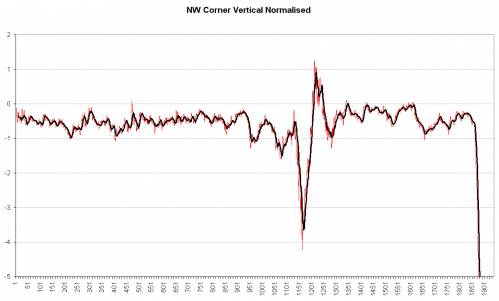
Demonstration of subpixel tracking of a point on the antenna:
9 point tracking used to trace the movement of one round ball on the antenna.
Camera shake is obvious (between frames 1150-1250).
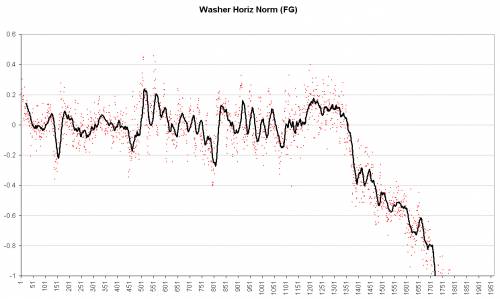
Black thick line is horizontal movement of the NW corner.
Grey is raw NW corner.
Blue is static point.
(Remember there would be a time delay between event and camera if indeed the source of shaking originated from WTC1)
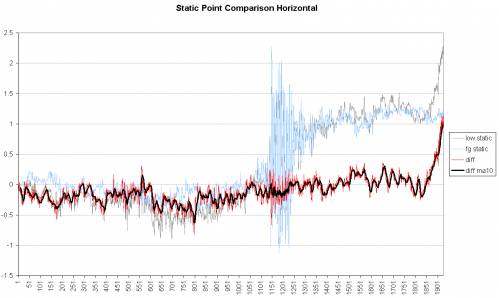
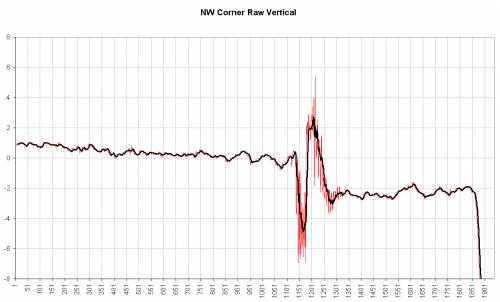
STATIC POINTS
Two static points are used, one in the foreground (on the building on the left of frame), and one low on the East side of the building. The locations are shown in the following linked images:
1) There is good correlation between both until near the very end of the trace, indicating that parallax effects are minimal between near and far field objects.
2) There is Westward movement of the static point on the building at the end of the trace.
3) Camera shake period should be obvious.
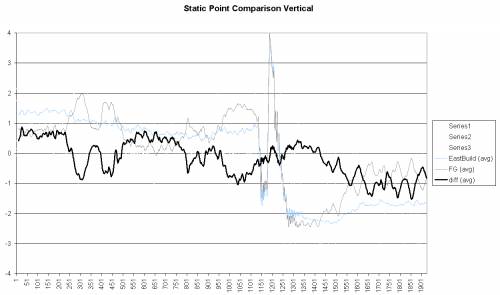
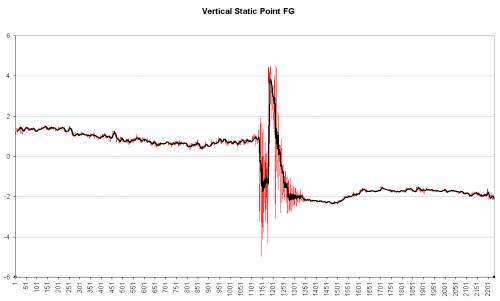
Static Feature Comparison (Vertical)
high res
Notes...
1) Slight gradual vertical drop of building static feature following camera shake.
I'm aware of stating movement of static features here, but I was expecting the traced point on the building to *stay* static.
Washer Horizontal Movement (Normalised to FG static point)...
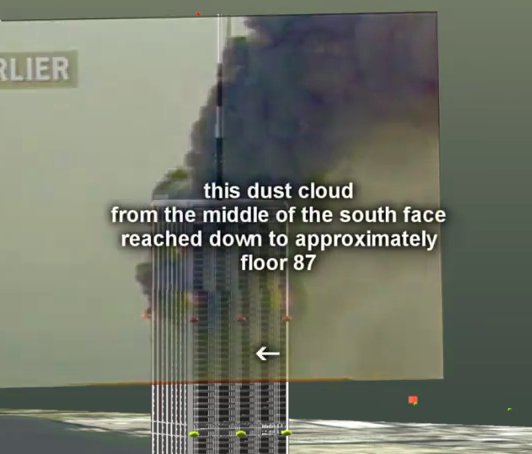
The following analysis is taken from this video clip. f# is frame number. Individual frames are shown and labeled below:
f755
f775
The following gif contains the 2 images above. There is an interval of 10 frames between each image (at 30 frames per second):
The frames within the gif are
f755 south side ejection from around floor 87 already visible
f765
f775 ejections appear around NW corner (green line) and along north and west faces of floor 98
f785
f795
f805
at 1/3rd second interval between images.
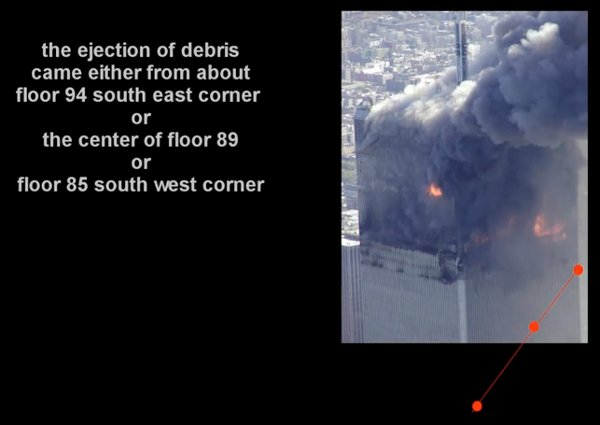
The ejection is located from the west view looking upward:
which means the ejection emerges from somewhere along the line shown:
The same ejection as seen from a second viewpoint from the south:
The ejections are located from the south view:
Therefore ejections extending as low as the 87th floor on the south face are visible before ejections appear along the north and west faces along the 98th floor.
Frames from overlays within this analysis are taken from this clip.
5) APPEARANCE OF SECOND OVERPRESSURIZATIONS: 95th FL W FACE EJECTIONS
The appearance of the 95th floor ejections is marked by a green line at the beginning of the graph. The ejections occur well before downward movement of the antenna, northwest corner, or the fire on the upper southwest corner of the building.
The following short video clip demonstrates beyond doubt that overpressurizations from the 95th floor and the 92nd floor emerge before those along the 98th floor and before visible downward movement of the building. It is taken from the larger clip linked in phenomenon #3.
only after the emergence of the 87th floor south face ejections and the 95th and 92nd floor west face ejections does visible downward movement of the building begin.
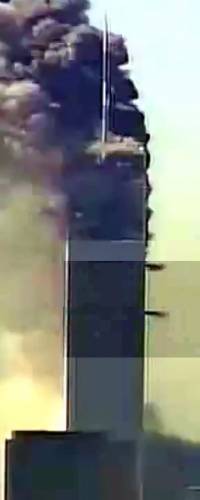
6) VISIBLE DOWNWARD MOVEMENT BEGINS: Concave deformation of the roof, antenna drops before north or west perimeter walls
Points from both the north (Sauret) and west (NBC) viewpoints are traced and plotted below:
Sauret viewpoint: NE corner, NW corner and large antenna drops compared
The antenna begins to move downward in frame 130. The NW corner doesn't begin to be displaced downward until around frame 210.
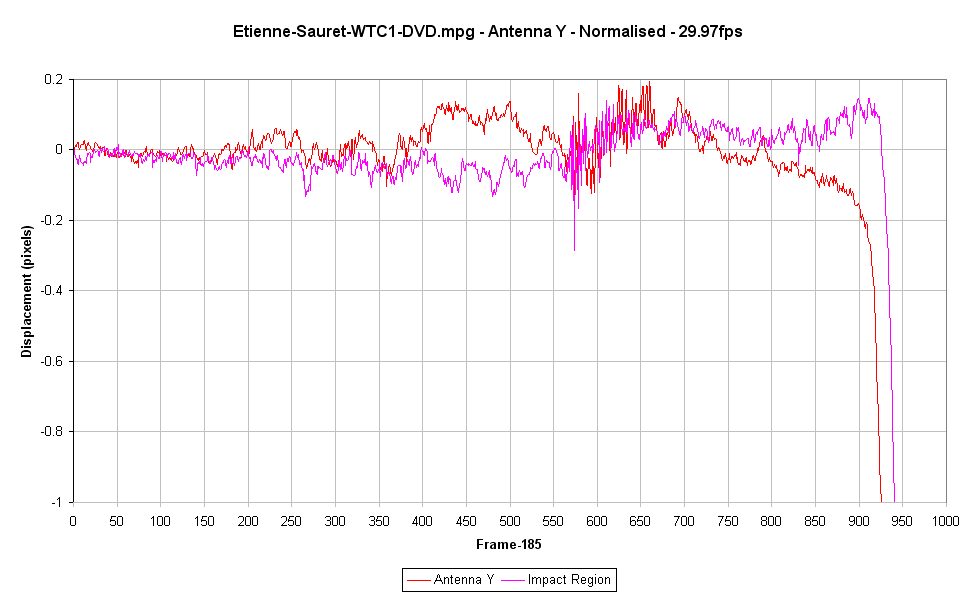
Antenna drop compared with downward movement of the impact region:
As you can see, downward antenna movement precedes downward movement of the impact region.
Global deformation movement from frames 120 to 220:
Looking from the Sauret viewpoint at the whole building above floor 92, flashing between frames 120 and 220 (just over 1.5 sec interval). Remember that the NW corner starts to accelerate downwards around frame 224. This simple visual tool allows you to verify that the tendencies documented in the drop and drift curves shown to you represent very real movement that grows into visible deformations. Movement from as early as Sauret frame 140 is visible to the naked eye:
In order to see the degree and direction of local deformation at any point, just hold your pointer still over that point and notice the degree of wiggle.
Notes:
1) The east corner of the building stays pretty still. The whole portion below floor 98 stays pretty still.
2) The NW corner window washer actually wiggles east-west. Almost no downward displacement, but observable eastward displacement.
3) Notice that the whole west corner above floor 98 is being pulled inwards. The pull-in first becomes noticeable just above floor 98 and grows much stronger in the top few floors.
4) From this projection, the antenna is moving downwards and hooking to the east. It is as if it is falling and slightly pivoting. It seems as if its eastward angle increases slightly over this interval.
Notice how the antenna fall seems directly related to the pull-in of the window washer on the NW corner. As if the building is being pulled downward from the eastern side of the core, pulling the antenna down with a slight pivot and the NW corner with it.
The outer columns of the building provide an excellent grid that allows one to see how the whole upper west side is being pulled over to the east, but the east side of the building remains still.
>>>>>>>>>>>>>.
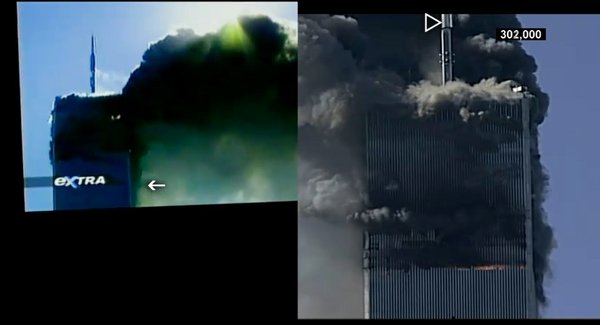
NBC viewpoint: antenna drop compared to SW corner fire drop and 95th and 98th floor ejections
The 95th floor ejections appear in the first frame of this animated gif image. The animation covers 70 frames at 25 frames per second.
frame 1: 95th floor ejections appear
frame 25: antenna starts to visibly move downward
frame 52: 98th floor ejections begin, 104th floor SW corner fire starts to visibly move downward
Downward movement of the antenna is measured well before the SW corner is observed to move.
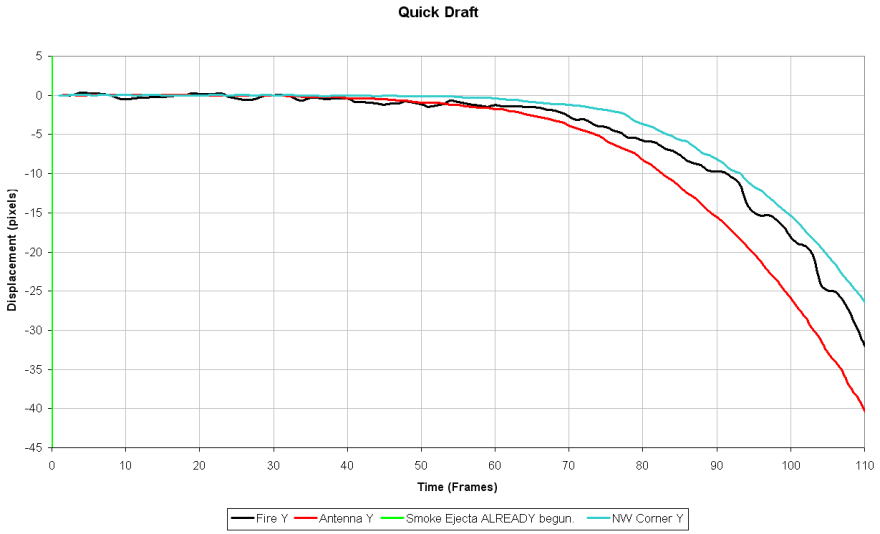
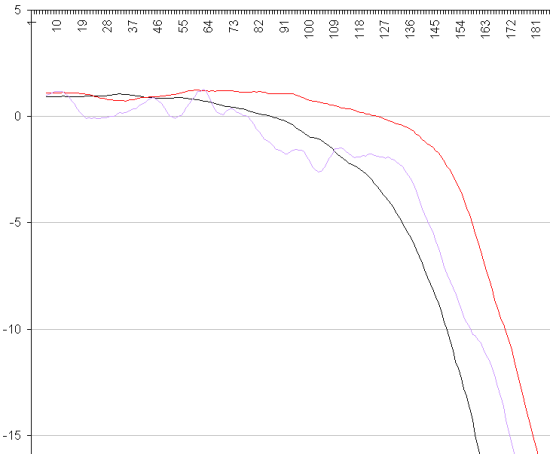
Measurement of the large antenna, SW corner fire and NW corner washer drops from the NW NBC viewpoint shows once again that the antenna was moving downward before the SW and NW corners of the building.
notes: Black - Antenna
Red - Washer
Purple - SW Fire
59.94 fps - Resolution Doubled. 1 pixel on the graph is 0.5 pixels on the original video.
Measurements from both viewpoints show early antenna movement when compared to any point on the perimeter of the building. All drop measurements and all visual evidence shows the antenna sinking into the perimeter of the building during the earliest detectable movements.
7) COLUMNS FAIL OVER TILT OF LESS THAN 1 DEGREE, APPEARANCE OF 98TH FLOOR EJECTIONS AND 105TH FLOOR EJECTIONS
The columns fail from south to north and from east to west so the clearly visible NW corner would be the last columns to fail. The moment of failure is shown:
By synchronizing the video from the northeast, north, northwest and west views, one can determine the moment the northwest corner fails by visual inspection. It can be easily verified that the northwest corner had already failed in the frames shown below:
The motion over which all columns fail as seen from the east:
The motion over which all columns fail as seen from the west:
A more precise determination of tilt angle:
Any capable person can determine tilt angles from various perspectives over which all columns fail by using a simple 4 step process:
A) Verify the west face fails from south to north:
B) Verify the north face fails from east to west:
C) Determine precise moment of failure of the northwest corner:
D) Measure tilt of antenna and other normally vertical features of the deforming structure from multiple angles at that moment
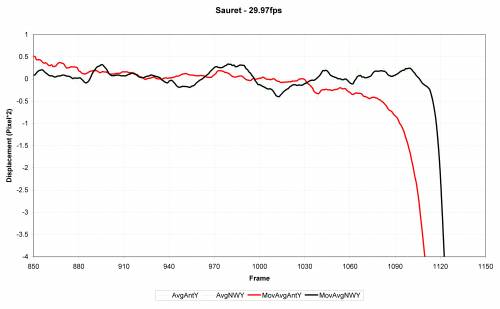
Steps 1 and 2 allow one to verify that the northwest corner is the last set of columns to fail. The precise moment of failure of the northwest corner can be determined by using the high resolution Sauret video and tracking the movement of the northwest corner:
The velocity curve in black allows the determination of the moment of failure of the NW corner with remarkable precision. One would naturally look at the point in which the velocity makes the initial sharp, downward transition. Both visual inspection and object tracking allow anyone to spot the moments of failure of the NW corner.
By synchronizing videos from other perspectives with the Sauret video from the north, tilt angles can be determined from each perspective.
This is the moment the 77th floor ejection first appears:
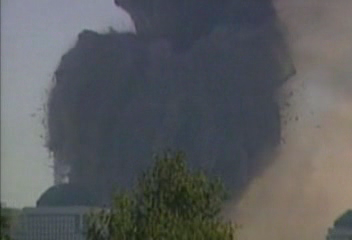
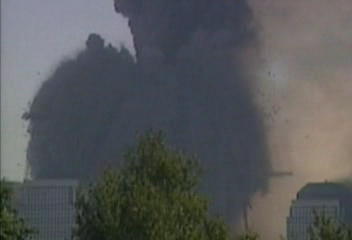
9) SPLITTING OF THE PERIMETER WALLS: ALL VISIBLE PERIMETER WALLS FAIL OUTWARD AND OVER THE LOWER PORTIONS
South Wall Motion visual reconstruction verifies the upper portion of the south wall fell out and over the lower portion.
North Wall Motion shows the same behavior; the upper portion fell out and over the lower portion
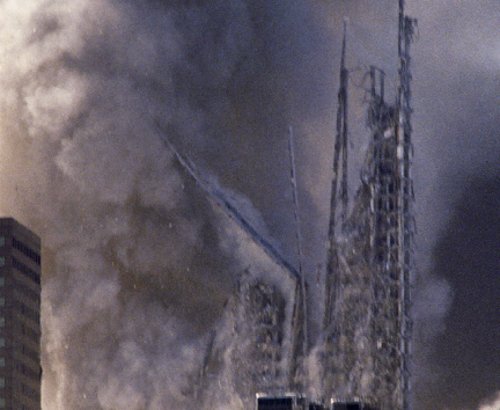
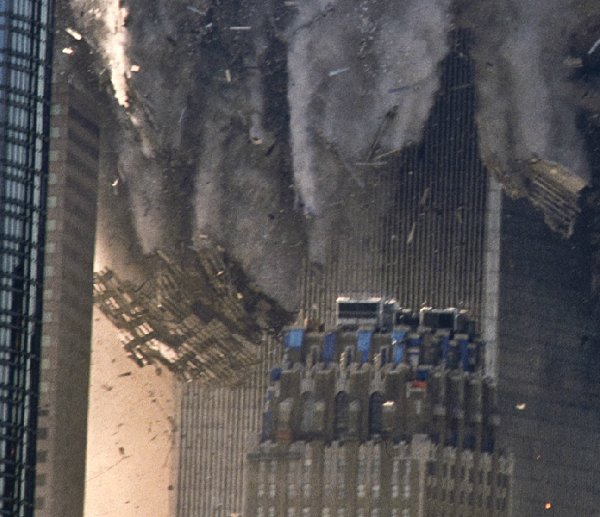
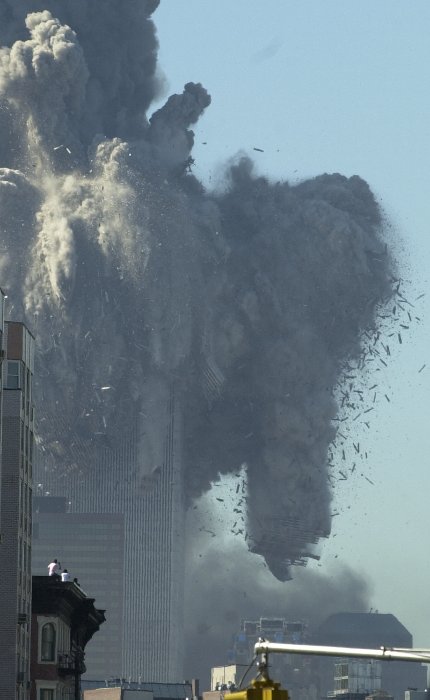
West Wall Motion visual recostruction verifies the upper portion fell out and over the lower portion. The upper portion is the large falling object seen in this image:
The upper parts of all visible walls broke outward and over the lower parts. It is the upper parts that break outward and free-fall as very large interconnected pieces.
10) SOUTHWARD SLIDING OF THE UPPER PORTION
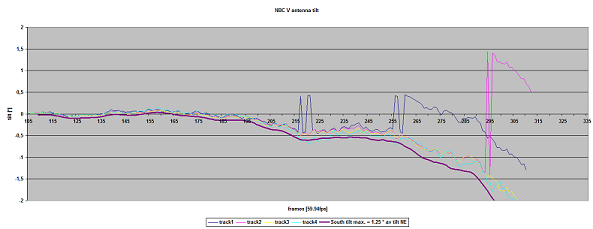
NE NBC viewpoint: Measurements of large antenna movement,
Angular movement of large antenna from NE, measured by tracking the horizontal difference between 2 points on the antenna
Between frame 165 and 217, the rate of antenna tilting quickened and reached about 0.75�. After frame 217, the rate of tilting of the antenna stopped for the next 40 frames. During that time the antenna merely shifted southward while the north face (upper floors) seem to have tilted a bit more.
The same motion as seen from the west:
Within these observations are multiple indications of collective core failure. As will be shown in section 3.2, not one of these observations is recognized in the NIST reports. This author could understand that the official reports could overlook an observation or two, but consider the multiple indications of collective core failure:
Early antenna movement
Pull in of the NW corner
The upper portion of the south, west and north walls fail outside and over the lower portion
The upper portion detaches from the lower portion and slides southward at less than 1 degree tilt
There are multiple indicators of the same behavior. None of these events are mentioned in the NIST reports.
Likewise, there are multiple indications that the WTC1 collapse did not begin on the 98th floor as the NIST claims. Not one of these observations is recognized in the NIST reports. This author could understand that the official reports could overlook an observation or two, but consider the multiple indications that the collapse did not begin on the 98th floor:
87th floor south face overpressurization
95th floor west face overpressurization
Increased pressure along the 92nd floor west face
77th floor west face ejections
As is demonstrated here none of these events are mentioned in the NIST reports.
11) DIS-INTEGRATION OF THE UPPER PORTION
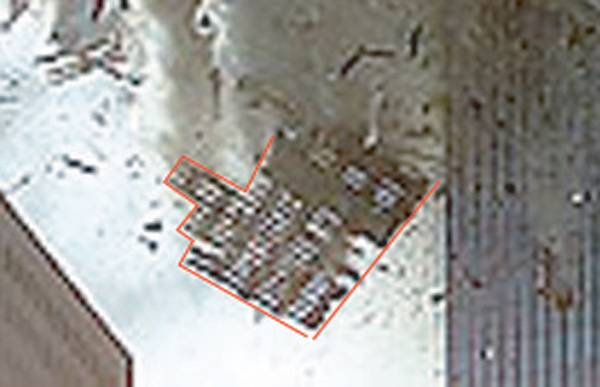
Zooms of these images reveal the upper south wall and a large section of the antenna have fallen out and over the lower south wall:
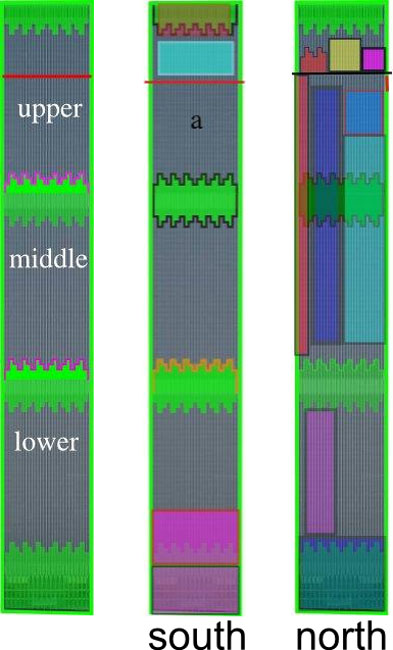
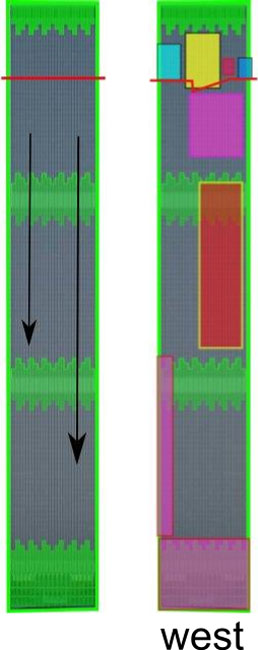
Each perimeter wall can be divided into 3 regions separated by reinforced MER (mechanical equipment room) spandrels. Collapse progression proceeds down different regions at different rates. Image on right shows identifiable sections of the WTC1 west perimeter.
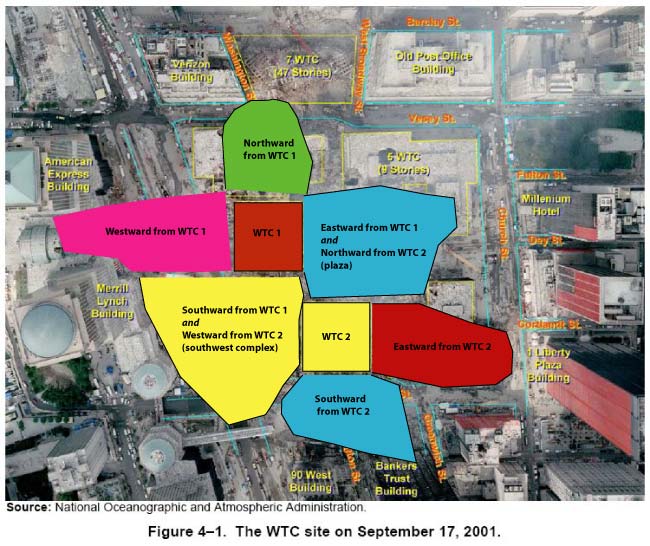
The largest publicly available collection of debris photos are linked below:
All photographs of the debris are grouped according to location and type.
It is hoped that by rearranging all known useful debris photos by region, the reader can see for themselves how debris was distributed throughout the complex and in what condition without being overwhelmed with too much confusing information.
Southward from WTC1 and westward from WTC2 share a region (we'll call it "southwest complex") and eastward from WTC1 and northward from WTC2 share a region (the plaza area). Hence 8 natural regions total.
All debris photos are divided into the following categories
Please notice how different this record of collapse progression movement is to that described by the NIST or Dr Bazant. This collapse record shows the specifics of highly ordered movement of the flooring, perimeter and core. This highly ordered process gives multiple indications of the most probable collapse mode of each tower: Progressive floor collapse as described in detail within section 2.1.
The NIST description and record of collapse initiation is also quite different from the movements and behavior extractable from the visual record. In this case, inward bowing is observed followed by the failure of all core and perimeter columns within a tilt angle of less than 1 degree.
It appears the perimeter is responding to partial core failure. Therefore, the actual mechanism of collapse is partial core failure leading to collective core failure, while the perimeter deformations are merely the response to core failure.


 Larger version: here