2.1 WORLD TRADE CENTER TWIN TOWER PROGRESSIVE FLOOR COLLAPSE MODEL
Careful, systematic observation of the WTC1 and WTC2 core remnants and perimeter motion allow for an understanding of the mechanism by which the Twin Towers collapsed. The perimeter seems to have been collectively stripped of flooring through progressive floor failure and fell outward as large, unbuckled, interconnected pieces while most core columns of the building survived the initial collapse.
In the case of WTC1, since the entire northern portion of the core survived unbuckled and the perimeter fell outwards, also unbuckled, it is concluded that the portion of the flooring that holds the perimeter to the core must have been stripped or eroded as debris initially descended to the ground, leaving much of the core standing and the perimeter unsupported.
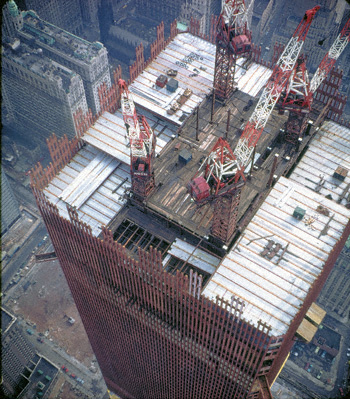
Fig 2.11 The areas in silver are the OOS regions, trusses spanning from the outer core to the perimeter.
OOS means Open Office Space flooring. It is a name the author gives for the flooring which was outside the core and connected the core to the perimeter walls to distinguish it from flooring within the core area. It is shown above as the shiny silver region encircling the core.
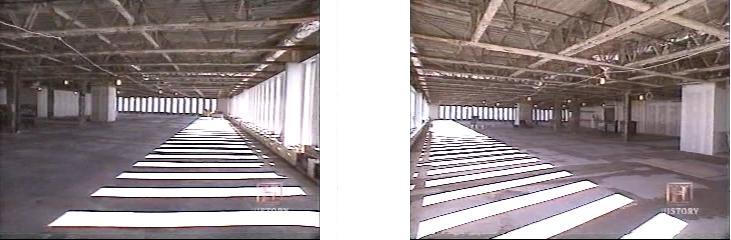
From within the building, the open office space is seen with an open ceiling with trusses spanning from the perimeter to the core:
Fig 2.12 The long span trusses from within the building.
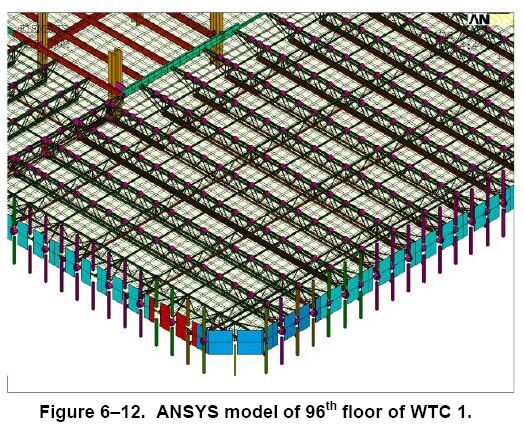
The layout of individual long and short span trusses on a typical floor:
Fig 2.13 The long span truss layout shown in NIST NCSTAR figure 6-2.
Details of an individual floor truss with connectors:
Fig 2.14 The OOS truss connections on the core side and the perimeter side from NIST NCSTAR Fig 2-6.
Observed perimeter behavior and the temporary survival of both cores indicate that the OOS flooring was most probably stripped from both perimeter and core, leaving the core standing and the perimeter unsupported. Neither core nor perimeter columns are buckled in the process. The leading collapse fronts must have been located mainly in the OOS regions around the core.
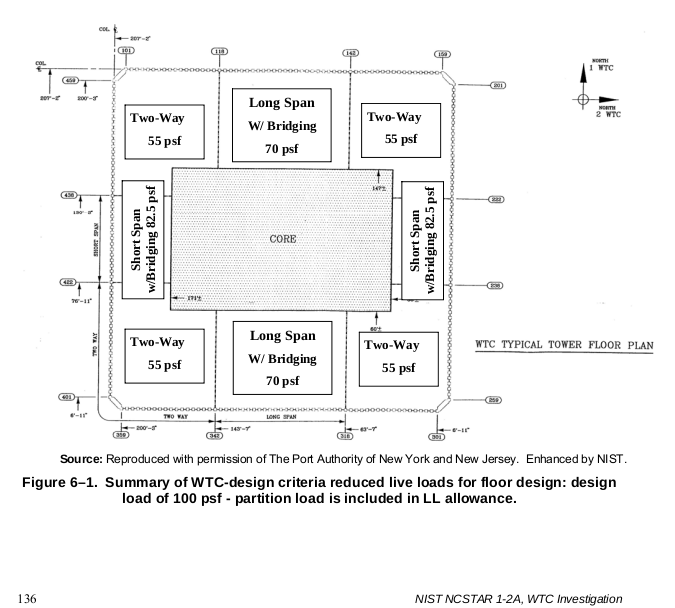
Live loads in the OOS region:
Fig 2.15 The live load capacity for the various OOS regions as shown in NIST NCSTAR 2.1A, figure 6-1.
Considering how the capacity to support live loads is regionally dependent, there is no reason to suspect that progressive floor failure in different OOS regions will propagate to earth at the same rate. For this reason, a typical OOS floor is divided into local regions similar to the divisions in the live load capacities.
A typical WTC 1 floor can be divided into 2 main sections having different strengths, one within the core area and another outside the core:
Open office space flooring (OOS)
Flooring within the core (CF)
The total OOS floor space can be divided into 8 smaller floor regions:
1) OOS directly north of the core (OOS n)
2) OOS directly east of the core (OOS e)
3) OOS directly west of the core (OOS w)
4) OOS directly south of the core (OOS s)
5) OOS northwest corner region (OOS nw)
6) OOS northeast corner region (OOS ne)
7) OOS southwest corner region (OOS sw)
8 ) OOS southeast corner region (OOS se)
These being, for the purposes of describing the model, 9 regions of a typical floor.
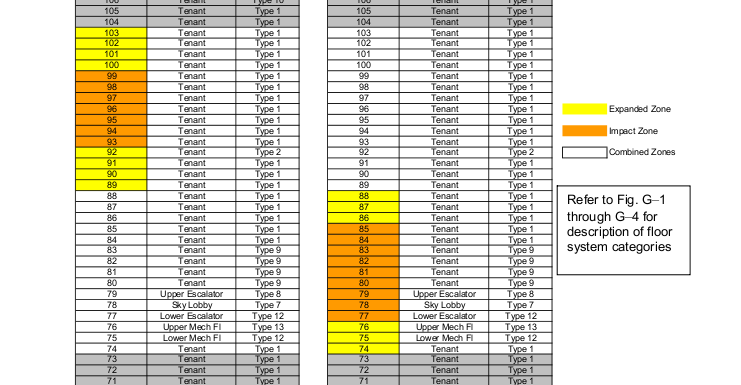
Furthermore, not all flooring is of the same construction. What has been called "typical" flooring is labelled type 1 within the NIST reports on the collapses.
Fig 2.16 Type of flooring within the aircraft impact regions, from NIST NCSTAR ___. WTC1 on the left, WTC2 on the right.
The orange regions are the floors which the aircraft struck. In the case of WTC1 on the left, all floors below the orange markings are of type 1 construction down to the 83rd floor. The floors with the strongest construction are the mechanical equipment rooms and the lower escalator floors. In the case of WTC2 on the right the MER floors are just below the aircraft impact region.
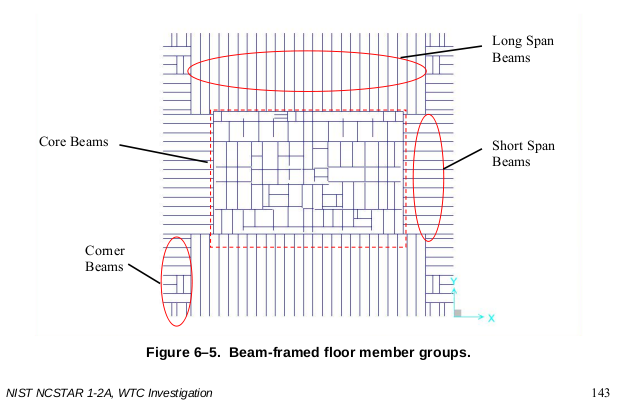
Beam flooring form possible discontinuities in OOS propagation rates
Type 12 and 13 flooring is constructed of beams to support the heaviest mechanical equipment within each building. The beam layout is shown below.
Fig 2.17 Special beam flooring layout in the mechamical equipment room (MER) floors, called type 12 and 13 flooring in fig 2.16, from NIST NCSTAR1.2A, figure 6-5.
Typical type 1 OOS flooring could be expected to be most vulnerable to progressive floor collapse, while the MER beam flooring would most probably be the most resilient to progressive floor failure.
OOS Collapse Propagation Involves No Column Buckling
A major feature of the OOS approach to collapse propagation is in the role and treatment of core and perimeter columns. For example, collapse propagation down the north side of WTC1 would be understood as accumulating debris trapped in a "basket" between the surviving core 500 row columns and the north perimeter of the building.
The model must treat both core and perimeter columns around the OOS n phase 2 boundary only as "guide rails" to funnel debris motion. Estimates of structural resistance in this region will therefore be based on capacity of OOS n flooring to resist being crushed by a distribution of rubblized debris falling on it. The downward propagation rate has nothing to do with column buckling strength since neither core nor perimeter columns directly resist the movement of OOS debris. They are simply bypassed.
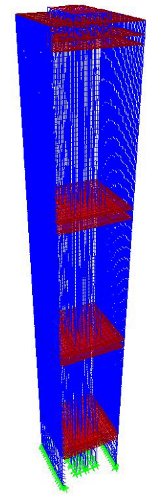
Fig 2.18 The special MER beam flooring is shown in red, from NIST NCSTAR figure ___
These MER regions would provide the most resistance to a progressive floor collapse within the OOS region between perimeter and core. In the case of WTC1 where tje collapse initiated within the 95-98th floor region, almost 20 floors of mostly type 1 progressive floor collapse could take place before the 75-77th floor MER level is reached.
The destruction can propagate down different OOS regions at different rates
Different OOS regions have different collapse fronts at different positions at any moment in time. The rubble in the OOS sw corridor of WTC1 was 10 to 15 stories ahead of OOS nw destruction midway into the collapse.
This means there were most probably different downward propagation rates in different regions. A regional approach to describing the collapse propagation means structural resistance, driving masses and equations of motion are regionally dependent.
Dividing the collapse into phases
Phases are natural physical stages in the collapse.
An OOS destruction model must allow for at least two different collapse phases:
1) Phase #1: process of mutual upper portion, lower portion destruction until the upper portion is essentially fragmented.
2) Phase #2: process of erosion after an intact upper structure disappears, leaving only rubblized debris smashing against the remainder of the building.
The crush mode must be different after the upper portion no longer acts as an intact "leveller". Current estimates seem to put this phase transition point near 10 stories below the collapse initiation zone. By allowing for the probable existence of different collapse phases, we are free to describe different successive crush modes employing different mechanics with transition points between them.
A major difference between phase 1 and phase 2 mechanics is that for phase 2 the rubblized zone has no rigid, fixed structure acting as a "crushing equalizer" or "leveling agent" above it. Questions of propagation mechanics such as speed of collapse, equations of motion or upward resistance force F are regional in nature. The upper portion of the building has ceased to exist as an intact structure and is now only the composite of 3 types of rubble (see footnote 1). Motion within different regions is no longer coupled or mutually dependent as it was during phase 1.1
PHYSICAL FEATURES OF THE COLLAPSES THAT SUPPORT THE MODEL
1) Observed Behavior of WTC1 Core
2) Observed Motion of WTC1, 2 Perimeter Walls
3) Observed Behavior of the Crush Fronts
4) Observation of core and perimeter columns within the rubble
5) Pieces of flooring remain intact and people survive at the base of WTC 1
6) Appearance at the base of each tower after collapse
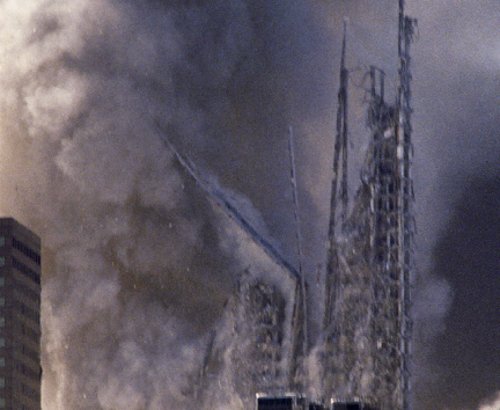
1) Observed Behavior of WTC1 Core
Fig _ The entire east-west width of the core
The entire northern portion of the WTC1 core survived the initial collapse to about the 50th floor with some columns extending as high as the 70th floor. all with no visible trace of buckling. All columns in the 500 and 600 CC rows remained erect and largely interconnected though the initial collapse. One 700-800 column pair was also identified, probably 703-803. There is good reason to believe that some other 700-800 column pairs survived to about the 40th floor because when the west portion of the surviving core did fall, column pair 501-601 was seen to fall with 703-803 in a single collective motion, suggesting all visible columns on the west were interconnected as a considerably larger structure just inside the obscuring dust. These images show that the flooring in the OOS n, nw and ne regions was stripped clean of the surviving columns.
IDENTIFICATION OF TEMPORARILY SURVIVING CORE COLUMNS:
WTC1:
Identification of west side columns
Fig 2.19 In the case of WTC1, the entire east-west width of the core survived the initial collapse. Animated gif version here
501 is the tallest column of all on the right and 504 is the tall one bending to the right.
We can see how 504 bends to the right and hits 503 clearest in this video:
Columns 504, tall and leaning, and column 501 can serve as easily identifiable landmarks in most all video and photos of the core remnant. We know that columns 501 to 504 mark the boundaries of the the west half of the core. We also know that all columns east of 504 must be from the east side of the core. In the image the east and west sides of the core are distinguishable just by locating columns 501 and 504
From the southwest two column pairs forming rectangles with different height to width (h to w) ratios are visible in this image.
The location of the photographer is known to be about 22 degrees from the building's east-west axis. This means:
width we see = actual width x cos(22) (roughly), while cos(22) =.93
Distance between 500-600 = 15.25 ft
between 600-700 = 20.5 ft
between 700-800 = 10.3 ft
distance between 704-805 = 9.5 ft
floor height about 12.5 ft
For the blue rectangle w>h while for the red one h>w giving h to w ratios matching the 500-600 row for the blue rectangle and 700-800 for the red one.
2) Observed Motion of WTC1, 2 Perimeter Walls
All observed exterior walls under the collapse initiation elevation of each tower fell away from the building as large unbuckled interconnected sheets of various sizes during the collapses. This fact becomes quite obvious as the observed movement and rubble layout on each side of the footprint is studied. This video is of west and north wall global movement. Please observe the obvious outward motion of the visible walls:
There were large interconnected perimeter sections of the west wall clearly seen in the resulting rubble:
WTC 1: Recorded Motion of the Perimeter Walls
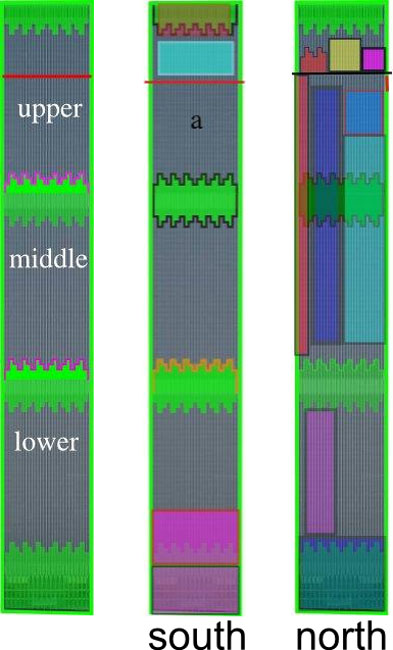
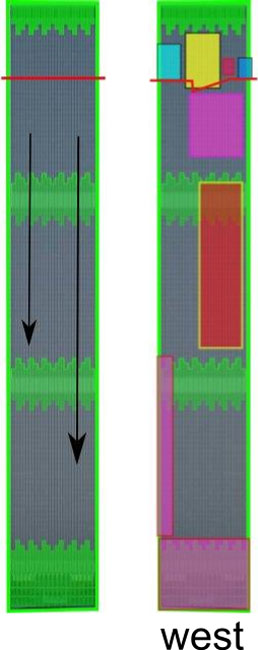
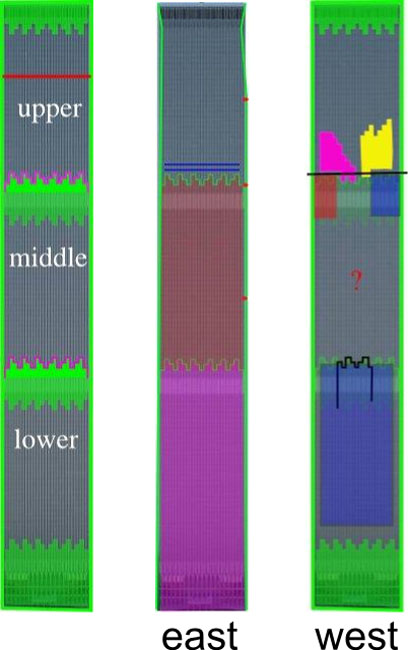
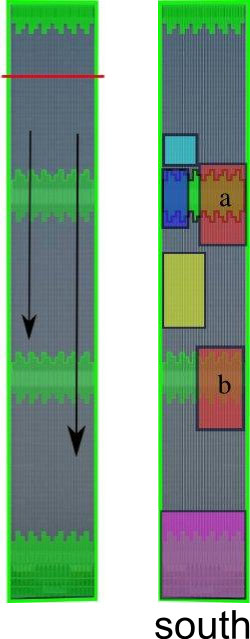
Images on right show identifiable and trackable large sections of the WTC1 south, north, and west perimeter walls marked by colored regions:
Fig 2.21 Each perimeter wall can be divided into 3 regions separated by reinforced MER spandrels. Collapse progression proceeds down different regions at different rates.
South wall motion is mapped at this link: South Wall
North wall motion is mapped at this link: North Wall
West wall motion is mapped at this link: West Wall
East wall motion is mapped at this link: East Wall
WTC 2: Recorded Motion of the Perimeter Walls
Images on right show identifiable and trackable large sections of the WTC2 east, west, and south perimeter walls marked by colored regions:
Fig 2.21 Each perimeter wall can be divided into 3 regions separated by reinforced MER spandrels. Collapse progression proceeds down different regions at different rates.
East wall motion is mapped at this link: East Wall
West wall motion is mapped at this link: West Wall
South wall motion is mapped at this link: South Wall
North wall motion is mapped at this link: North Wall
A perimeter wall collapse model that matches all observables at this link
3) Observed Behavior of the Crush Fronts
The Case of WTC1
High quality video shows the dynamics of the different collapse fronts at work. Linked below are high quality clips that show details of the OOS nw and OOS sw collapse fronts. It is very clear within the video that OOS sw leads OOS nw front by a considerable, ever increasing margin.
When viewing these clips one should remember that much of the core, including the entire east-west width of the northern 500 and 600 CC rows survive the initial collapse with cross bracing intact. This means that the core, just 37 ft within the west wall and 60 ft within the north wall, remains intact while the collapse front progress to the ground.
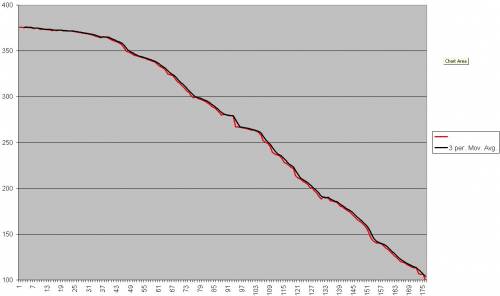
Collapse front propagation rate down WTC1 southwest corner
MEASURED COLLAPSE PROPAGATION RATE: A collapse front down the west face of WTC1 remained visible and measurable down to the lower floors. The movement shows a relatively constant velocity after quickly leveling off after collapse initiation. The velocity is approximately 25m/s, or about 8 floors per second being destroyed. To the author's knowledge this is the first time that the propagation rate of a progressive floor collapse was measured.
Initial data for linear ejecta traversal from West face of WTC 1:
The Case of WTC2: Observed behavior of the east side of WTC2
Observed behavior of the east side of WTC2
It is clear that such evidence points to only one natural mode of possible progressive destruction: The OOS model.
Current knowledge of WTC perimeter action with discovery that the entire north half of the WTC1 core survived the initial collapse leaves little doubt that complete OOS destruction, essentially stripping the OOS flooring from both the perimeter and the core, was the mechanism by which the collapse propagated down the tower. Runaway OOS Destruction (ROOSD) is the only known descriptive collapse propagation model which matches observations.
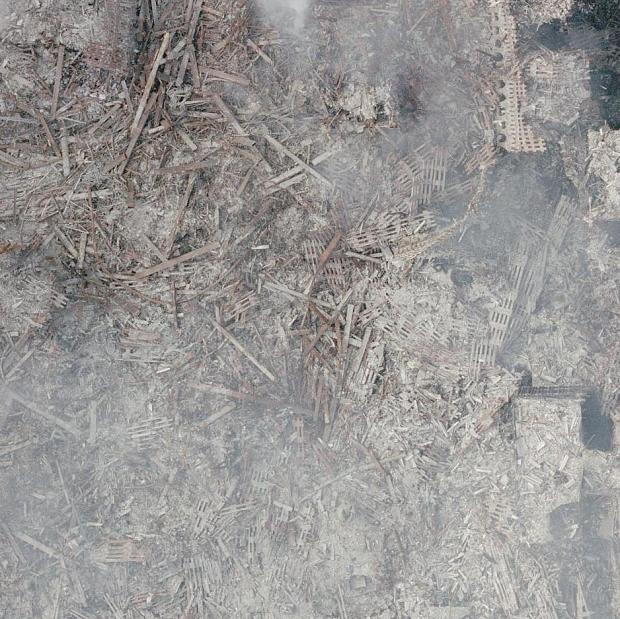
4) Observation of core and perimeter columns within the rubble
The overwhelming majority of core and perimeter columns within the rubble were were seen to be relatively straight, showing no evidence whatsoever of having been buckled. The almost complete absence of buckled columns is a vital clue to the true collapse progression mechanism, though the NIST seems oblivious to this fact, not having mentioned it once in in it's reports on the collapses. Dr Bazant, to whose expertise the NIST refers concerning WTC1 collapse propagation, seems equally oblivious to the actual condition of these columns since no mention of this fact appears of his papers on the subject of collapse propagation (Bazant and Verdure or Bazant and Le). Dr Bazant formulates equations to describe the rate of collapse propagation based on continuous column buckling and rebuckling in Bazant and Verdure, even though there is a clear absence of buckled columns within the rubble.
The true conditions of core and perimeter columns as they were positioned in the rubble can be seen by using the largest photo collection of the original layout of the rubble publicly available. Debris photos are grouped by region to allow the reader to get a sense of the rubble layout in each region without being overwhelmed or disorientated.
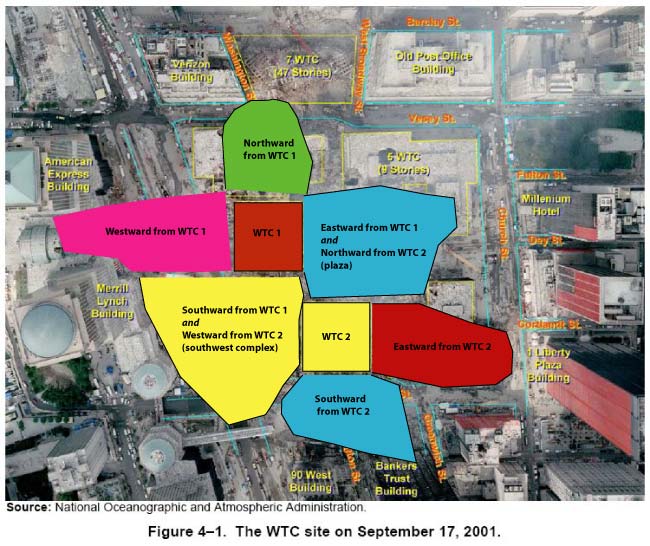
RUBBLE LAYOUT
All photographs of the debris are grouped according to location and type.
It is hoped that by rearranging all known useful debris photos by region, the reader can see for themselves how debris was distributed throughout the complex and in what condition without being overwhelmed with too much confusing information.
Southward from WTC1 and westward from WTC2 share a region (we'll call it "southwest complex") and eastward from WTC1 and northward from WTC2 share a region (the plaza area). Hence 8 natural regions total.
All debris photos are divided into the following categories
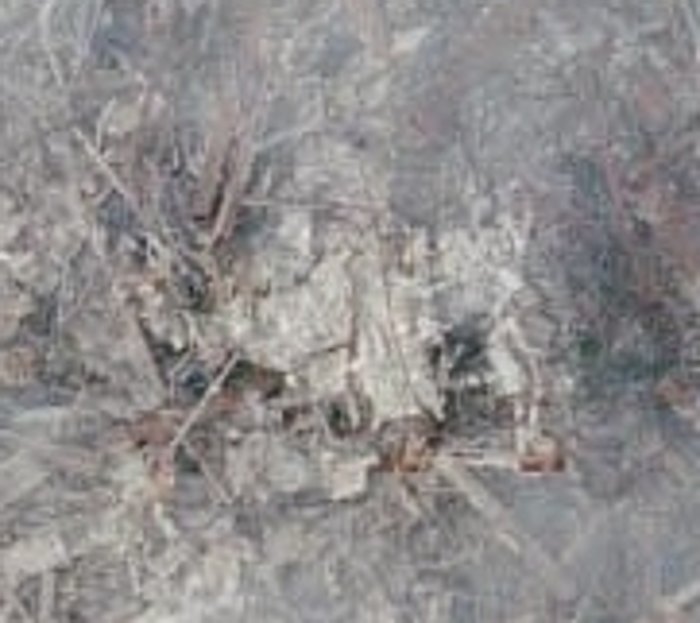
5) Pieces of flooring remain intact and people survive at the base of WTC 1:
A small surviving core structure within WTC1:
Notice the floor slabs that survived the fall of one of the largest buildings on the planet directly above them.
When the ROOSD propagation hit earth, the whole perimeter was most probably (completely) enclosed. A massive, completely trapped impact results and the final collapse of each wall follows.
When the smoke clears, fragile flooring is still intact in the center of the footprint and some person actually survived in there.
The ROOSD debris cannot escape the funnel. This is important to realize. The ROOSD propagation takes place within a totally enclosed caging at all moments, even as it strikes earth. Initiating ROOSD may be as simple as just getting enough heavy objects inside the funnel and getting out of the way. If enough mass is dumped inside a funnel (it doesn't matter how high or how low it is done), it cannot stop.
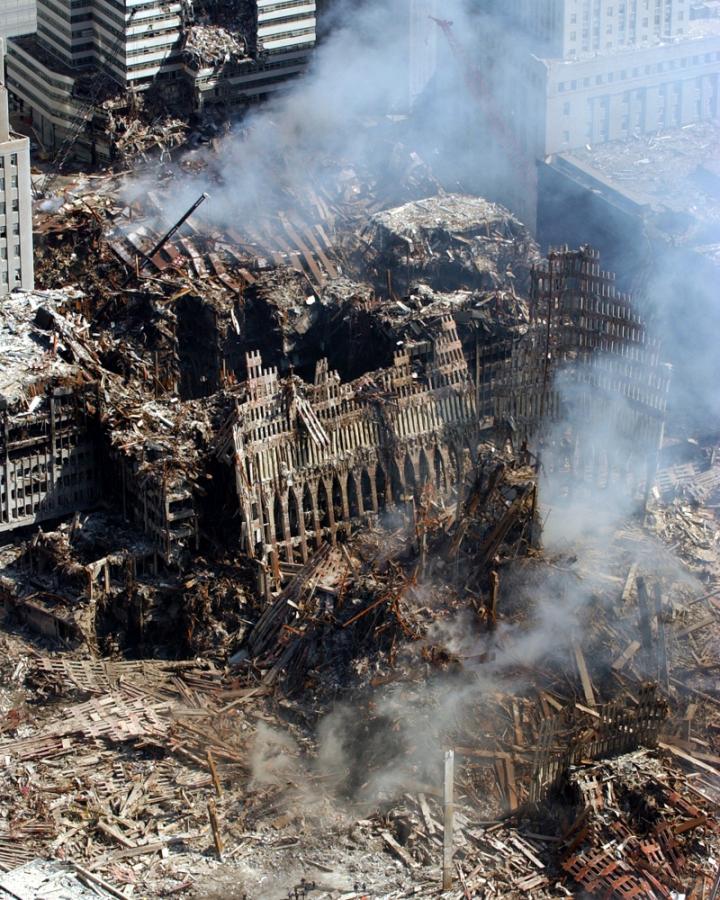
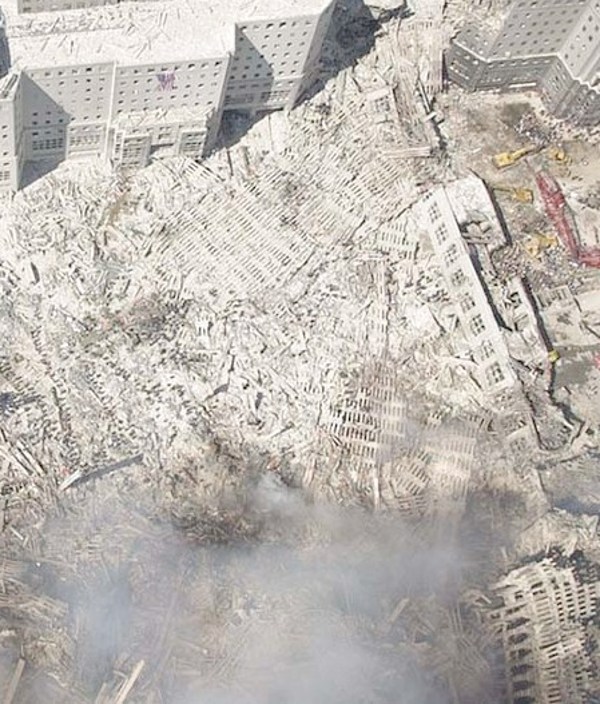
6) Appearance at the base of each tower after collapse
Anybody considering the ROOSD process to earth probably assumes that the propagation will hit the lowest basement levels while the perimeter shell is still enclosing the ROOSD debris. So, when striking the earth, the whole perimeter through at least 20 floors and the tridents are still tubular and intact.
We may assume that the damage of the west wall spreading out from the footprint happens after this collision takes place. The west and south walls were erect and most probably still interconnected at all 4 corners when the massive collision takes place.
One can imagine how the damage occurs after the ROOSD mass strikes the earth, the massive outward pressurization upon impact. That means the mound shown in the footprints is the actual ROOSD debris, with some core columns sprinkled above as the core finally collapsed.
7) ROOSD may help explain the degree of pulverization of objects and the massive quantities of dust
INITIATION FEATURES THAT COULD LEAD TO ROOSD CONDITIONS: Phase 1 motion
A process very similar to the ROOSD description of progressive floor collapse has been modelled mathematically by A.G. Vlassis, B.A. Izzuddin, A.Y. Elghazouli and D.A. Nethercot. The paper "Progressive Collapse of Multi-story Buildings Due to Failed Floor Impact" is available at this link.
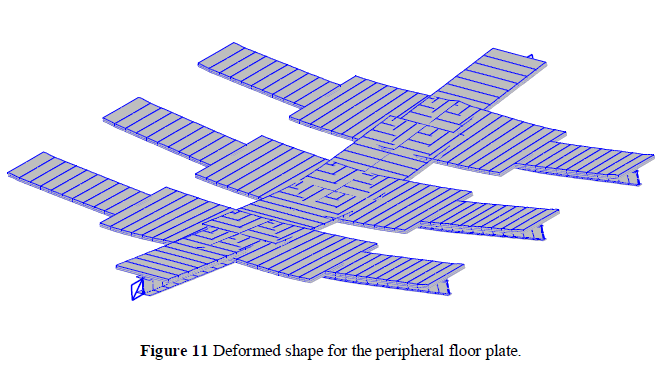
From the paper a deforming slab responding to impact:
From the introduction:
"It is concluded that such structures are susceptible to progressive collapse initiated by impact of a failed floor, mainly due to insufficient ductility supply under combined bending and axial deformation modes. Moreover, the development of shear failure modes is identified, thus further increasing the observed vulnerability of the studied floor system. Since these shear
modes of failure are expected to be even more pronounced when the actual dynamic rather than the static response of the impacted floor is considered, the need for further research work focussing on the shear capacity of a variety of connection types subject to extreme events is established. Finally, practical design recommendations that can improve the impact response of floor systems exposed to impact from the floor above are made."
page 24: "Hence, it can be easily concluded that in the event of failure and subsequent impact of a single floor plate onto the floor plate below, the lower impacted system, modeled using a grillage-type approximation, is highly unlikely to possess sufficient dynamic load carrying capacity to resist the imposed dynamic loads and prevent progressive collapse."
page 26: "Thus, although assessment is based on a simplified grillage-type approximation rather than a detailed slab model, the explicitness of the results leads to the conclusion that a floor system within a steel-framed composite building with a typical structural configuration has limited chances to arrest impact of an upper floor. This is particularly true when the falling floor completely disintegrates and falls as debris without retaining any residual strength or spanning capability."
page 27: "To conclude, although there is room for further improvements with respect to its accuracy and applicability, the proposed assessment methodology provides an effective platform to rationally tackle the scenario of floor impact, which is one of the most prevalent progressive collapse initiation mechanisms."
The author does not claim to provide answers to what initiated the fall of WTC1. Collapse initiation is a highly complex subject involving early structural deformity and a very rapid lateral failure propagation of core and perimeter columns.
ROOSD is a collapse propagation model, applicable only once certain ROOSD conditions are met. The following description of phase 1 motion is meant only as the most general description to show how such conditions may come about. The question of initial buckling is completely bypassed as we simply displace and drop an upper portion onto the lower building.
General features of phase 1 mechanics:
Let's imagine dropping an intact "upper block" over the lower portion as shown in the graphic. This is the simplest possible case with no lean. The same can be done with a slight tilt.
The top is offset about two feet to the right and dropped. Our OOS collapse model treats the structural elements thus:
Core columns act as breakable spears, breakable at welds or bolted connections every 3 floors. Core columns are like "matchsticks" (just as they are found in the rubble). The 36 ft sections are not crushable.
Perimeter columns act as 2 dimensional sheets. No buckling (just as they are found in the rubble). Not crushable.
Concrete floor slabs are strong but crushable. Floor-perimeter and floor-core connections are breakable.
The First Collision
What is the very first impact? Floor against floor. Core columns act as spears. Columns puncture floor in core. Punctures go both up and down.
How does the perimeter collide with the building? The left and right sides are different cases. It depends on which sheet gets the inside advantage. On the right, the bottom slides inside the top and the lower perimeter hammers against upper floor connections. This strips the upper perimeter from it's flooring. On the left it is the opposite. The top perimeter sheet slips inside the bottom and collides against lower block outside floor connections acting as a hammer.
If the lower building was not there the top would go into freefall. Collisions hindering the building from freefall give a practical sense of the sources of resistance force F encountered. The first collision is in the core and along both perimeters as shown:
Both upper and lower core columns act as spears puncturing flooring. We can assume that the floor sheets, 4" concrete, won't do much to stop them. We see a destruction through spearing happen to both upper and lower flooring.
Along the perimeter we see only the lower floor slammed on the left and only the upper floor smashed on the right. Notice how different the damage is, depending on whether the lower perimeter sheet slips within or outside the upper sheet. Inner position is important.
The second collision.
Floor slab meets floor slab. The overlap region is in yellow. Will this create a jolt along the roofline? Would there be a jolt if the top was leaning slightly? Maybe and maybe not. We may assume so, but we notice the perimeter wall administered a shock to the outer flooring connections in the last collision. Wouldn't the perimeter spandrels smashing and breaking outer flooring connections send a pulse to the perimeter roofline more effectively than floor slab collisions?
In reality, it may not be stubby sections of perimeter columns that are smashing against the floor connections but the spandrel plate instead. The spandrel plate acts as a powerful hammer against flooring connections.
Each slab is an independent structure and is held onto the building only through perimeter and core column connections. Were it not for these connections each slab could move freely.
What is the nature of this collision? Neither slab has an advantage in the collision, so the destruction and connection breakage would be shared evenly. Each can be crushed. This collision must result in the disconnection of both slabs from the larger structures.
Please consider:
1) The slab resists disconnecting from the larger structure only as the strength of the connections allow. Were the slab strength and connection strength infinite the collision impulses would be transferred to the columns, core and perimeter. With finite connection strength the roofline fall would be slowed only as much as connection strength and floor crushing will resist breakage.
2) How does column yield strength enter into this collision? With finite floor connections it doesn't. There is no connection whatsoever, demonstrating one way that the OOS destruction model differs with the Bazant and Verdure approach.
3) What collisions act to slow the fall? (What is the source of resistance force F?) Connection breakage and rubblization of slabs.
Stripping the perimeter of flooring: The inside advantage
In the case of WTC1 (and WTC2 n, w and s walls) the upper perimeter walls are seen to fall outside the lower wall on all observable faces. We can see how this simple change in initial positioning can destroy the physical integrity of the upper block in the the diagram:
On each of the 8 WTC1, 2 faces very different phenomena result from whether the upper perimeter sheet or lower perimeter sheet slips to the inside during the earliest failure). This simple fact changes the mechanics of destruction along the outer OOS flooring. If the upper sheet slips (or is intentionally pushed) outwards, the subsequent behavior along that face changes.
The lower perimeter breaks successive outer floor connections along the red line. It strips the upper block perimeter columns from their flooring. Pop, pop, pop, pop all the way up. If the process were reversed (as shown on the left side of the building), the lower block perimeter would be stripped from it's flooring (as seen along WTC2 east face). Such a process may effectively disconnect and rubblize the OOS floor slabs along their outer edges, creating ROOSD conditions within the OOS zones.
If this is true, what is a large part of the resistance force F which controls the building descent as measured along the WTC1 north face roofline? It is the perimeter-floor connections and their resistance to being destroyed.
The ROOSD descriptive model of collapse propagation: Phase 2 motion
Is runaway OOS destruction possible?
How much debris would need to accumulate in OOS zones traveling at what velocity impacting the floors below to create a runaway process?
What "threshold" must be overcome to achieve runaway conditions?
These fundamental questions require a mathematical formulation of the ROOSD model.
TOWARD A MATHEMATICAL MODEL: PROPAGATION MECHANICS
General Conditions of ROOSD mechanics will take the form:
for rubblized driving mass > M(1) moving at a downward velocity > V(1) , the runaway process is assured. (threshold limits to initiate ROOSD)
If driving mass M is large enough and the downward velocity V is large enough the conditions will probably escalate. (conditions in which ROOSD is sustained)
These descriptive and mathematical approaches to explain the collapse progression for WTC1 cannot account for the temporary survival of the entire northern portion of the core. The general description of WTC1 collapse propagation offered by Dr Bazant in Bazant and Verdure(2007), Bazant and Le(2008) and Bazant, Le, Greening, Benson(2008) cannot account for many of the physical observations presented in this study. Within the body of literature offered by Dr Bazant on the subject of WTC1 collapse progression there is no hint that Dr Bazant is even aware of the absence of column buckling, the temporarily survival of the whole northern core or the outward motion of the perimeter.
In the WTC1, 2 design a runaway destruction potential seems to have always existed in the OOS spaces completely surrounding the cores. This process, once set in motion, can destroy all OOS space and strip the 4 perimeter walls from all support of the floor trusses all the way to earth.
__________________________
1In phase 2 there is no more intact building above the rubble zone. The rubble in phase 2 consists of at least least 3 different types of rubble:
a) Core and perimeter columns (much more core than perimeter). Very elastic, very strong, very dense, retains original shape with minimal deformation.
b) Thinner metal components crushable and deformable (trusses, sheet metal flooring) pretty inelastic, easily bent but cannot be pulverized. Remains in "stuff" like a stringy, wire-like material.
c) Material that can be pulverized, ground up and reducible. This material when sufficiently pulverized has the unique property of being able to permeate the first two types of rubble and escape entrapment within the "basket". For the same reason this material cannot contribute to the crush front as an effective concentrated hammer. Very little elasticity.]
2 Other Important papers for mathematical formulations for the potential for progressive floor collapse:
Vlassis, A.G. (2007). Progressive Collapse Assessment of Tall Buildings, PhD Thesis, Department of Civil and Environmental Engineering, Imperial College London.
Kaewkulchai, G., and Williamson, E.B. (2006). “Modelling the Impact of Failed Members for Progressive Collapse Analysis of Frame Structures,” Journal of Performance of Constructed Facilities, ASCE, 20(4), pp. 375-383.
Jarrett, N. D. (1990). “Axial Tests on Beam/Column Connections,” BRE Client Report CR 55/90, Building Research Establishment, Garston, Watford, UK.
Anderson, D., Aribert, J. M., Bode, H., and Kronenburger, H. J. (2000). “Design rotation capacity of composite joints,” The Structural Engineer 78(6), pp. 25-29.
Note: The first section of data is very difficult to determine (the curved section) and further work is required to separate the initial descent ejecta from the latter linear ejecta.


 http://femr2.ucoz.com/photo/6-0-219-3 (1234x731px/67.0Kb)
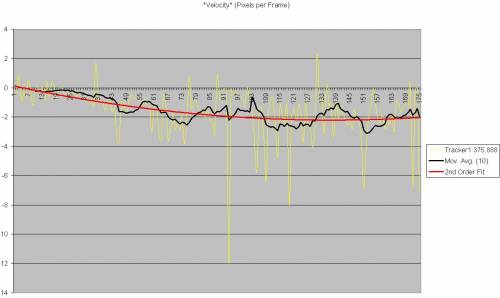 http://femr2.ucoz.com/photo/6-0-220-3 (1224x730px/87.3Kb)